Wild, feral or escapees?
Synopsis : How far do swarms move? Can estimates of environmental apiary and hive densities help determine whether “isolated, lost or ancient” bees are anything of the sort?
Introduction
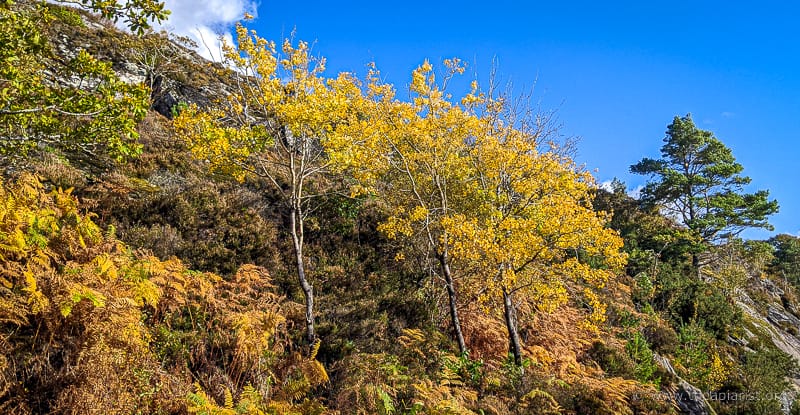
A little more on feral colonies this week. It’s an interesting topic to think about as the temperature drops, the wind picks up and the trees change into their autumn finery.
If there are any colonies in the local woods, how did they get there and what are their chances of survival?
I discussed some answers to this last week, using the specific example of old-growth forests in Germany (Kohl et al., 2022). In those cases the reality was that the majority of colonies perished within a year – the average time they survived was only ~32 weeks.
The most likely explanation for their presence in the forest was ‘spillover’ of lost swarms from managed colonies in neighbouring farmland. My assumption – though this wasn’t covered in the paper – was that the colonies perished from either disease or starvation.
This week I want to consider the isolation – or otherwise – of ‘remote’ forests and the distance swarms travel from their origin. Inevitably this will involve some back of an envelope calculations and even outright guesstimates {{1}}, so I’ll finish on a more familiar topic (to me) by briefly considering the pathogen loads of feral colonies.
Are these feral healthy and thriving, or riddled with disease?
Beekeepers and hives …
There are about 50,000 beekeepers in the UK and they manage about 250,000 hives.
That’s two ’abouts’ in one sentence, so the guesstimates have started already. The National Bee Unit reports there are 272,000 hives in the UK (2021 figures). They call this an ‘experimental statistic’ because ’several assumptions formed part of the calculations’ {{2}}. This number is up from 247,000 in 2017.
I suspect some of these assumptions include extrapolating from the numbers of beekeepers/apiaries and hives registered on the National Bee Unit’s BeeBase. In 2013 this was 29,000 beekeepers managing 126,000 colonies.
That extrapolation is needed as not all beekeepers are registered on BeeBase {{3}}, in the same way that not all beekeepers belong to a national or local association.
I’m going to ignore our commercial cousins, the bee farmers. There are only about 400 of them and only one or two of them manage more than 1,000 colonies.
The 2013 BeeBase numbers suggest that registered beekeepers manage 126,000/29,000 = 4.3 hives each. My opening sentence to this section would indicate that the average is perhaps about 5 hives. However, if the experimental statistic is correct but beekeeper numbers are still around 50k, then it’s a little over 5.4 hives per beekeeper.
Let’s keep the maths simple … on average, beekeepers manage 5 colonies 😉 .
… and apiaries
Unfortunately, I’m not aware of any publicly available statistics on hive density, but there is at least partial information available on apiary density.
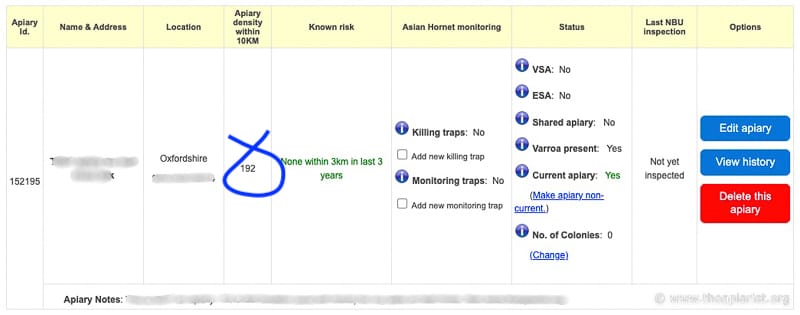
If you are registered on BeeBase, two of the things you record are the apiary location and the number of hives in each apiary. Once an apiary is registered you can determine the ‘Apiary density within 10 km’ {{4}}.
A radius of 10 km from your registered apiary encompasses 314 km2, so it is perhaps not surprising that there can be a large number of other apiaries in the neighbourhood.
When I lived in Warwickshire my two apiaries – separated by ~5 km – had 255 and 267 apiaries within a 10 km radius. This is a busy beekeeping area, with a very active local association (my alma mater, WLBK).
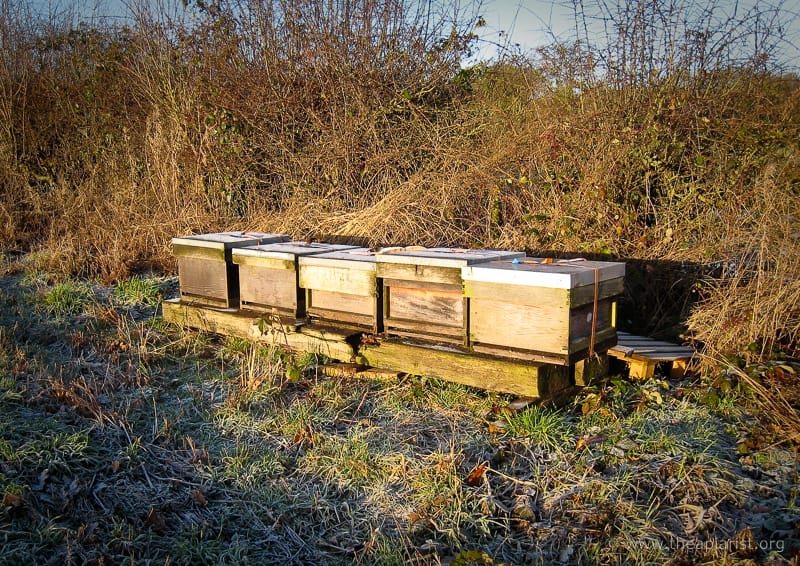
I don’t know how many hives there were in the surrounding environment, but it seemed as though almost every field margin or spinney contained a little row of hives balanced on old pallets.
Convenient assumptions
On the basis that I don’t have any other information, and in the interest of getting on with the article, I’m going to assume that each apiary contains an average of 5 hives. I think this is reasonable, though I’d be interested if anyone has any real figures.
With ~260 apiaries within 10 km, each containing an average of 5 hives, it suggests the hive density was 4.1 km2.
Coincidentally {{5}} this is almost exactly the same figure quoted in Kohl et al., (2022) last week.
And each year a significant proportion of these hives will attempt to swarm.
Swarms
With exemplary swarm control it is possible to avoid losing any swarms.
Of course, we do our beekeeping in the real world, and the reality is that we all lose swarms sometimes.
Hopefully not many and perhaps not even every year, but swarms are lost.
When I lived in Warwickshire I never failed to attract swarms to my bait hives each season. When I lived in Fife – where there were only ~45 apiaries within 10 km {{6}} – I caught four swarms in a bait hive in my back garden one season, and (again) never failed to attract swarms in the time I lived there.
Although I’d like to think this reflects the care I take in preparing my bait hives, I suspect it really means that – during the swarming season – a lot of queen cells are missed and swarms are lost.
Bivouacs and scout bees
Generally, though there are exceptions, the swarming process goes something like this:
- the colony starts producing queen cells
- on the first good day (warm, dry, fine etc.) after the first queen cells are sealed the colony swarms
- the swarm bivouacs nearby, perhaps only 10-20 metres away
- scout bees survey the environment for likely new nest sites, ‘dancing’ on the surface of the bivouac to persuade other scout bees to check out promising looking locations
- a quorum decision is reached by the scout bees on the ‘best’ new nest site and they lead the swarm there {{7}}
The scout bees survey at least a 2-3 km radius around the original hive; they probably start this process before the colony swarms, continuing it once the swarm has bivouacked. Since we can interpret the waggle dance, it is possible to observe the scout bees and infer from them the approximate distance and direction to the selected nest site.
By doing this, scientists have determined how far swarms usually travel (a relatively short distance) and how far they sometimes go (a long way).
Swarming distances
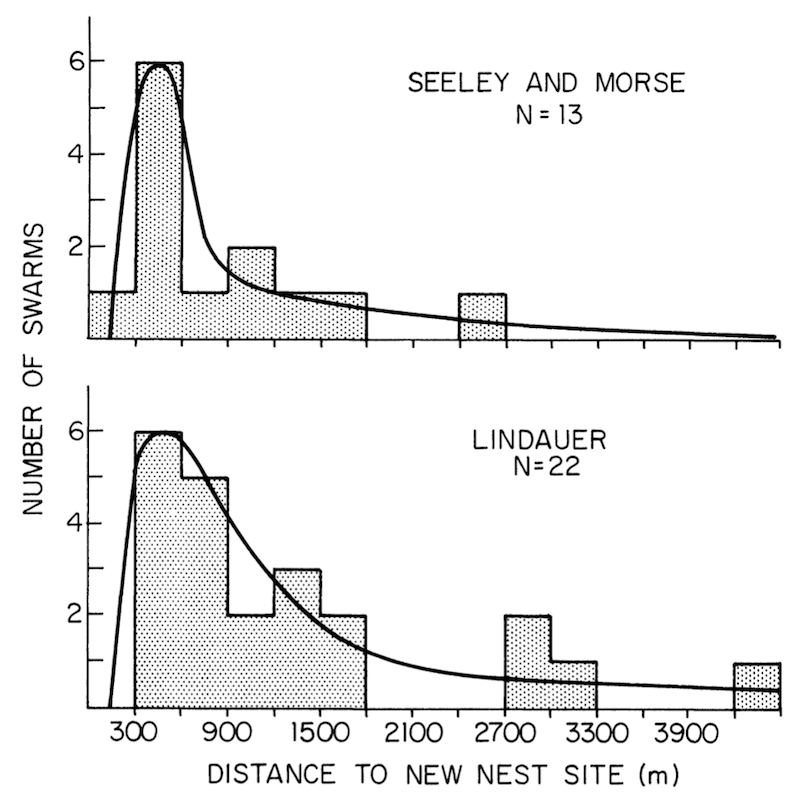
Most swarms relocate just a few hundred metres from their origin. Martin Lindauer did some of the first studies on swarming distances in the mid-50’s and Thomas Seeley and Roger Morse produced strikingly similar data in 1977 (Seeley and Morse, 1977).
There are a number of related studies from the early 1980’s which demonstrate that, although scout bees may survey the environment from ~300 m to over 4 km away, at least 50% of swarms move no more than 1 km from their origin.
However, they can travel much further.
In recent studies José Villa studied swarming of bees in Louisiana (Villa, 2004). He studied swarm size (weight), nest volume preference and the timing of swarming. In addition, by interpreting scout bee waggle dancing, he recorded the distance 16 swarms travelled from their origin.
In this study a marked preference for relatively ‘local’ nest sites was not seen. Four swarms travelled less than 1 km, six from 1 to 4 km, five between 4 and 7 km and one ~10 km.
With three of the swarms, two that moved <500 m from the origin and one 2.2 km away, he confirmed their location by finding the uniquely tagged queen present in the original swarm.
Although I said ’they can travel much further’ it’s worth remembering that the distance travelled was inferred from the duration of the waggle run by scout bees on the surface of the bivouacked swarm (and specifically, the predominant dances being conducted 30 minutes before the swarm left the bivouac).
That’s not quite the same as proving that swarms may travel 5-10 km, but it is certainly suggestive that they do.
Isolated woodland in a bee-filled environment
Let’s do a bit more arm waving …
Assume there’s two to three thousand hectares of old native woodland, oak, beech, sycamore etc., rather than conifers. In the absence of black woodpeckers (see last week) some of these trees will still contain hollow cavities. They will have lost boughs or been hit by lightning, the rain will have rotted the exposed heartwood and a cavity will eventually form.
Voilà … a potential nest site for bees 🙂
A wood of 2500 hectares (or is that a forest?), if circular, fills a circle of 5.6 km diameter. Of course, it’s very unlikely to be circular, but it makes the maths easier so bear with me.
Assume this wood is in the middle of good quality mixed farmland, with early season oil seed rape, hedgerows filled with hawthorn and blackberry, and ample clover polka-dotted pasture.
In other words, a good environment for honey bees.
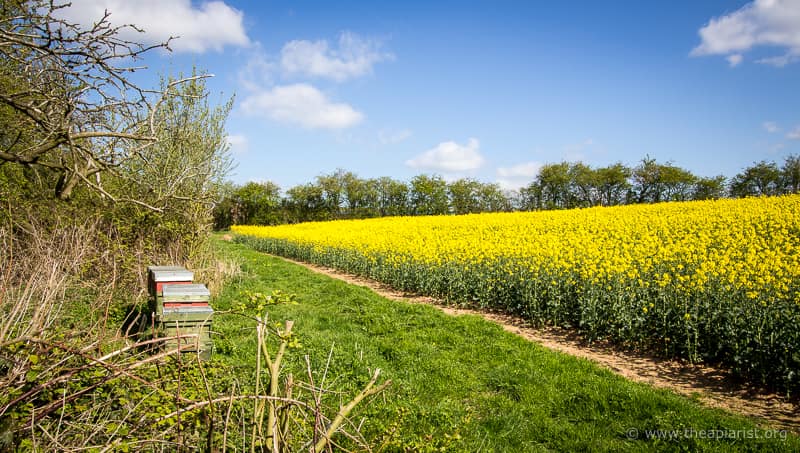
So the local beekeepers plonk a few hives in the corners of fields, or along field margins.
Eventually, the density of these hives reaches 4 km2 (as justified above).
In the diagram above the inner (green) circle is the native woodland. The surrounding blue and red rings represent the surrounding farmland, in each case the area covered by an additional 1 km radius respectively from the centre.
The woodland contains no managed colonies and is 24.6 km2. The blue ring (excluding the central wooded area) has an area of 20.7 km2 and so contains – based upon all those assumptions above – 83 managed hives. Likewise, the red ring has an area of 27 km2 and contains 108 hives.
Define ‘isolated’
As shown above, 50% of swarms move no more than a kilometre to a new nest site, but some move further … and a few may move much further.
Any of the managed hives in the blue ring might produce a swarm that could reach the forest boundary. In addition, assuming the blue ring contained few suitable nest sites – and I’ll return to this point shortly – swarms issuing from hives in the red ring might well travel further and reach the forest.
In fact, if you overlay the roundel diagram with the swarm dispersal diagram – at the same scale – from the paper by Villa (2004) you can see that swarms from a very wide area are ‘in range’ of the hollow tree-filled forest.
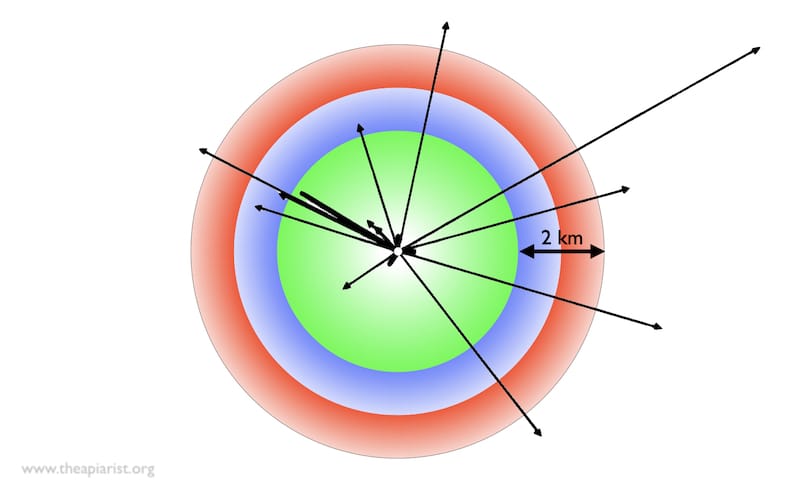
Woodland (green) and surrounding farmland with – at the same scale – swarming distances from Villa (2004)
The swarm dispersal diagram shows the swarms starting from a central point, so you just need to imagine the arrows are reversed.
In fact, if you assume that swarms can travel up to 7 km (only one swarm studied by Villa may have gone further, but one third travelled 4-7 km) there could be as many as 517 potentially swarming colonies ‘in range’ {{8}}.
Therefore, as far as migrating swarms are concerned, it’s quite possible that none of the forest is ‘isolated’.
Nest sites in farmland and forests
In the Kohl et al., (2022) paper I discussed last week, the majority of the woodpecker holes used by bees were in large beech trees. The average diameter of the trees was 55 cm when measured 1.5 m above ground.
These were substantial trees.
Trees of that size are common in old growth forest … but they’re rare in farmland.
Hedging, if it hasn’t been grubbed up, contains predominantly small trees. Many small copses and spinneys have also disappeared, all to make way for combine harvesters and subsidies.
Of course, there are large trees in farmland, they’re just a whole lot less common than they are in old native woodland.
Therefore swarms issuing from managed hives on farmland – assuming they don’t end up in one of my bait hives – are more likely to gravitate to the forest as there will be more nest sites there.
Blenheim bees
I don’t know much about the widely-publicised ‘Blenheim bees’ that I briefly introduced last week.
However, I do know that the Blenheim Estate near Oxford has about 2500 hectares of woodland, and that there are a lot of beekeepers in Oxfordshire.
That 2500 hectares, if circular (which it isn’t) and centred on Blenheim Palace, would span from Combe to Oxford Airport, and completely covers the small market town of Woodstock {{9}}.
This is a popular area for beekeeping. The National Bee Unit’s ‘BeeBase’ informs me that there are ~200 apiaries within 10 km of Blenheim Palace. Combe to the west has ~190 apiaries within 10 km.
If these apiaries have the expected number of hives in (i.e. 4 km2, and I see no compelling reason why not … for example, the countryside is similar to Warwickshire) then there are a very large number of colonies capable of producing swarms that are well within range of the forested area.
But let’s just revisit that figure of ~200 apiaries within 10 km.
How accurate it is?
Certainly some of the apiaries will have been ‘forgotten’ and are now vacant. I bet there’s a lot of redundant data on BeeBase.
Perhaps ~200 apiaries is not a very accurate figure?
I think it is probably inaccurate … but I strongly suspect it’s an underestimate rather than an overestimate of apiary numbers in the area.
Many beekeepers are not registered on BeeBase. Only the National Bee Unit knows {{10}} the proportion of beekeepers/apiaries/hives missing, but I’d be amazed if it was less than 25% and not at all surprised if it was 40%.
This is probably part of the ’fiddle factor’ used to extrapolate from BeeBase registrations and hive numbers to that ’experimental statistic’ of 272,000 hives in the UK.
Occam’s razor, the law of parsimony, and ‘isolated’ feral/wild bees
Are there self-sustaining populations of honey bees in the UK?
By self-sustaining I mean not dependent upon an annual influx of swarms from nearby managed colonies. These swarms compensate for the very high winter attrition rate seen in the Kohl et al., (2022) study which is likely due to pathogens and starvation (I’m going to deal with pathogens – briefly – next).
Well, are there?
I don’t know.
Based upon registered and predicted apiary and hive numbers, and the known distances swarms migrate, I think the simplest – and therefore most likely – explanation for feral colonies in ‘isolated’ locations are recent (< 1 year) swarms from nearby managed colonies.
Even assuming the National Bee Unit’s predicted 272,000 hives are evenly distributed over the entire UK (242,000 km2) that’s still >1 hive / km2. They’re obviously not evenly distributed; many areas are unsuitable or, at best, borderline for beekeeping.
I’d like to have been able to discuss the area of old growth forests in the UK and how isolated or otherwise it is. Unfortunately, I don’t have the data … or the GIS mapping skills to interrogate it.
Therefore I’ll close instead with something I know a little more about …
Feral colonies, pathogens and genetics
How healthy are feral colonies in the UK?
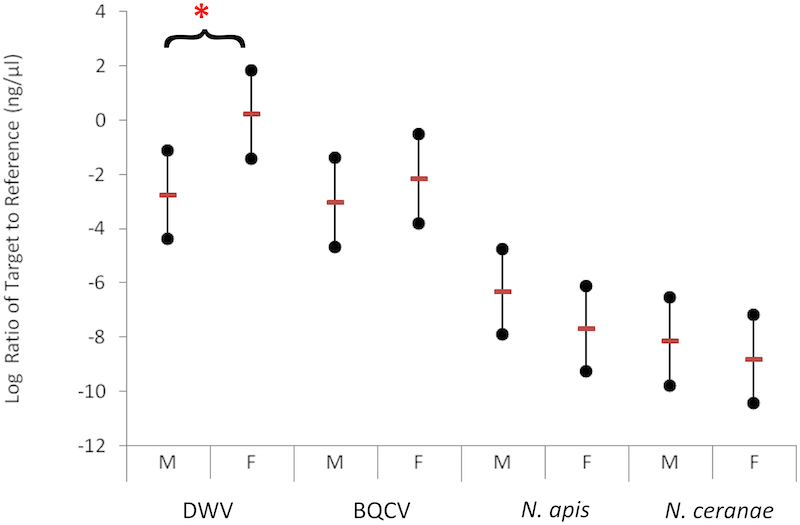
There aren’t a lot of published studies. Catherine Thompson and colleagues showed that the pathogen load – including Deformed wing virus (DWV), Black queen cell virus (BQCV) and Nosema (both apis and ceranae) – were similar or higher in feral colonies than in managed colonies (Thompson et al., 2014).
Levels of DWV in feral colonies were significantly higher than in managed colonies, but they were similar to the levels seen in beekeeper’s hives not treated to control Varroa infestation.
We know – though many are still bitterly reminded every year – that colonies in which mite levels are high and uncontrolled usually perish overwinter.
Catherine Thompson also studied the genetic characteristics of feral colonies and compared them to managed colonies (Thompson, C. PhD. thesis, University of Leeds, 2010). Her results show that the feral colonies she studied were very similar – and effectively indistinguishable – to managed colonies when the overall level of genetic heterozygosity was analysed. This means that these feral colonies are not a distinct genetic race of bees.
That’s not the same as showing they were genetically related to (and so originated from) nearby managed colonies … those experiments still need to be done.
Are these wild bees self-sustaining, unique and ancient?
If a colony or two of bees (or even a hundred) are found in the woods I’d suggest the following tests need to be applied to convincingly demonstrate they are a unique and self-sustaining population.
- how isolated are they really? Are there managed colonies within 5-10 km that could act as a source of swarms? Geographic isolation may be due to factors other than distance, for example an island population, or an isolated valley surrounded with mountains.
- is the population truly self-sustaining? Do colonies regularly survive for sufficient time to reproduce? To be self-sustaining, annual colony losses must be less than or equal to new colonies established from the same feral bees.
- are the bees genetically distinct from managed colonies within 10 km or so? If they are a well-established population you would expect this.
If the population is truly isolated, reproduces sufficiently to replace annual losses and is genetically distinct, then it may well be self-sustaining.
However, if it doesn’t meet any one of these three criteria then I suspect the population is dependent upon ‘spillover’ losses of swarms from neighbouring managed colonies.
Interesting perhaps, but not surprising, not unique and certainly not ancient.
Unsurprisingly, I’m sceptical about many of the claims made for long lost and unique strains of bees living in the woods (or anywhere else for that matter).
A glimmer of hope (?) … the Arnot Forest bees
The Arnot Forest is not dissimilar in size to Blenheim estate (17 km2 vs. 24 km2).
However, it is surrounded by lots more old growth forest (100+ years) and so is effectively more isolated. There are some managed colonies in the surrounding forests, but – when tested – they were genetically distinct from the Arnot Forest bees (Seeley et al., 2015). Finally, the colony survival characteristics (~1.5 years) and annual swarming of the Arnot Forest bees indicates that the population is self-sustaining. These Arnot Forest bees have adapted to live with Varroa through behavioural changes – frequent swarming, small colonies etc.
Clearly, self-sustaining populations of feral colonies can exist {{11}}, but this is not the same as claiming that all feral populations are self-sustaining, unique or ancient.
Finally, it’s worth noting that the mechanisms that self-sustaining populations of bees have evolved to become Varroa tolerant (they are unlikely to be resistance) – small, swarmy, colonies – may make them unsuited for either beekeeping or pollination.
References
Kohl, P.L., Rutschmann, B. and Steffan-Dewenter, I. (no date) ‘Population demography of feral honeybee colonies in central European forests’, Royal Society Open Science, 9(8), p. 220565. Available at: https://doi.org/10.1098/rsos.220565.
Seeley, T.D. et al. (2015) ‘A survivor population of wild colonies of European honeybees in the northeastern United States: investigating its genetic structure’, Apidologie, 46(5), pp. 654–666. Available at: https://doi.org/10.1007/s13592-015-0355-0.
Seeley, T.D. (2017) ‘Life-history traits of wild honey bee colonies living in forests around Ithaca, NY, USA’, Apidologie, 48(6), pp. 743–754. Available at: https://doi.org/10.1007/s13592-017-0519-1.
Seeley, T.D. and Morse, R.A. (1977) ‘Dispersal Behavior of Honey Bee Swarms’, Psyche: A Journal of Entomology, 84, pp. 199–209. Available at: https://doi.org/10.1155/1977/37918.
Thompson, C. (2010) The health and status of the feral honeybee (Apis mellifera sp) and Apis mellifera mellifera population of the UK. phd. University of Leeds. Available at: https://etheses.whiterose.ac.uk/5211/ (Accessed: 19 October 2022).
Thompson, C.E. et al. (2014) ‘Parasite Pressures on Feral Honey Bees (Apis mellifera sp.)’, PLOS ONE, 9(8), p. e105164. Available at: https://doi.org/10.1371/journal.pone.0105164.
Villa, J.D. (2004) ‘Swarming Behavior of Honey Bees (Hymenoptera: Apidae) in Southeastern Louisiana’, Annals of the Entomological Society of America, 97(1), pp. 111–116. Available at here.
{{1}}: Though, as ever, I’ll try and keep these ‘informed’ guesses.
{{2}}: This sounds like someone else making guesstimates, I’m in good company.
{{3}}: And if you’re one of them, then why aren’t you?
{{4}}: Pedants interlude … density should be apiaries per unit area, but they just report an integer within a radius.
{{5}}: Er, not … I think this isn’t an unreasonable number for a well populated area with good local forage.
{{6}}: With one sixth the apiary, and presumably hive, density than the Midlands.
{{7}}: All the glorious details are described in Thomas Seeley’s excellent book Honeybee Democracy
{{8}}: And, for completeness, 1158 colonies within 10 km of the centre of the wood.
{{9}}: No, not that Woodstock.
{{10}}: Or can guesstimate.
{{11}}: I never said they couldn’t … I’m just sceptical of some of the wild and poorly evidenced claims made.

Join the discussion ...