Chips with everything
Synopsis: How do you accurately measure flight times and durations of hundreds of bees? And why would you want to do this anyway? Using the same technology as Marks and Spencers label stock items, albeit on a smaller scale, it is now possible to monitor thousands of honey bee flights very accurately.
Introduction
As a beekeeper, you’re well aware of the size and appearance of a honey bee. Considering the workers only, they are all pretty much the same size and they all look rather similar.
Yikes … I’m only two sentences into the post and I feel the need to add a couple of interesting caveats:
- honey bees are unusual (amongst bees) in that there is much less variation in the size of individual workers within the population {{1}}. This might aid the accuracy of the waggle dance … {{2}}
- however, that size is not constant. For reasons that are not really understood, the size of honey bee workers increases during the season, by a small but significant amount {{3}}.
OK, let’s get back on track …
Considering this similarity, how can you tell if and when a particular bee returns to the hive?
For example, if you’re interested in the distance from which a bee can successfully return to the hive.
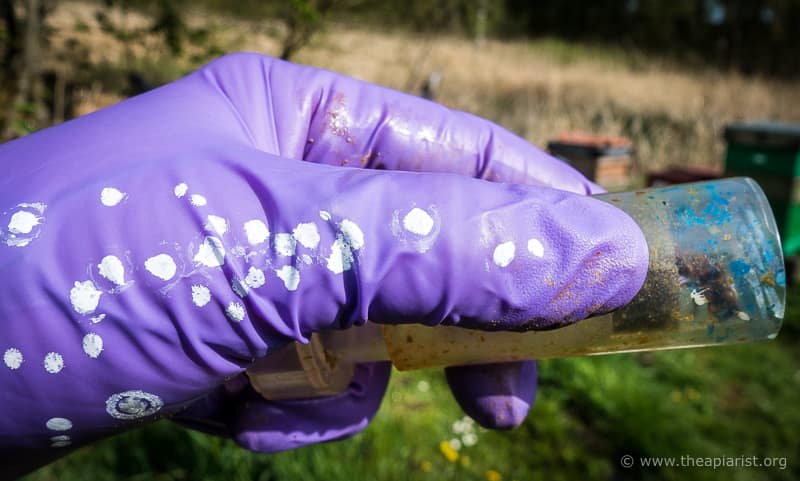
The obvious thing to do is to mark the bee, in the same way you would mark a queen, with a small coloured spot of paint on the thorax.
Small bees, big numbers, Posca pens
But, returning briefly to that very slight increase in size of honey bees during the season, scientists often need to make multiple repeat observations to get statistically significant results {{4}}. This becomes a problem as Posca only do a limited range of colours … you might be able to label bees with only eight different colours.
Mr Blobby goes beekeeping
Or 64 combinations if you use two colours per bee … or 512 if you use three colours together.
There are problems with this. Firstly, it takes a lot of time to put two or three separate dabs of paint onto the thorax of a worker bee. Secondly, the thorax is a rather small target for a rather fat pen (do you remember your first attempt at queen marking? 😉 ).
One way round this is to add dabs of paint to the abdomen as well, or instead, of the thorax. A bigger target certainly, but there are then issues with ensuring flexibility and not blocking the spiracles and a host of other things, so not ideal.
But, even if you could label a few hundred bees with unique colours, you’d then have to sit next to the hive entrance for hours at a time recording the arrival of blue-green-red (or was that green-red-blue? {{5}} ).
Not ideal … particularly if you are colourblind.
Actually, almost impossible.
But, thanks to Leon Theremin, the Russian inventor of the eponymous musical instrument and developer of the spookily named listening device “The Thing”, the RFID tag was created.
“The Thing”
“The Thing” was a covert listening device hidden in a plaque proudly displayed inside the American ambassador’s Moscow residence for seven years {{6}}. It was a so-called ‘passive cavity resonator’. When energised by a radio signal of the correct frequency (which – surprise, surprise – was transmitted by the Russians) it would pick up sound waves from the room, causing a membrane to vibrate. This vibration could be detected by a receiver (which – you guessed it – the Russians also had) and a decoder, thereby allowing conversations to be heard.
искусный as they say in Russian {{7}}.
RFID tags and honey bees
And, on a somewhat smaller scale, that’s pretty much how radio frequency identification (RFID) works.
There are two components:
- an RFID tag or chip which is attached to whatever you want to uniquely identify. You’ll be entirely familiar with these are they are often attached to price tags of items in shops (where they are used for stock control). They essentially consist of a microchip and an antenna.
- an RFID reader which emits the radio signal to activate the tag and then ‘reads’ the information sent back. Typically this information includes a unique serial number {{8}}.
RFID tags can be tiny. Hitachi make one that is 0.0025 mm2 which can store a 38 digit number. That’s smaller than a speck of dust. This brings a whole new set of problems as the antenna is so small that the range is only millimetres.
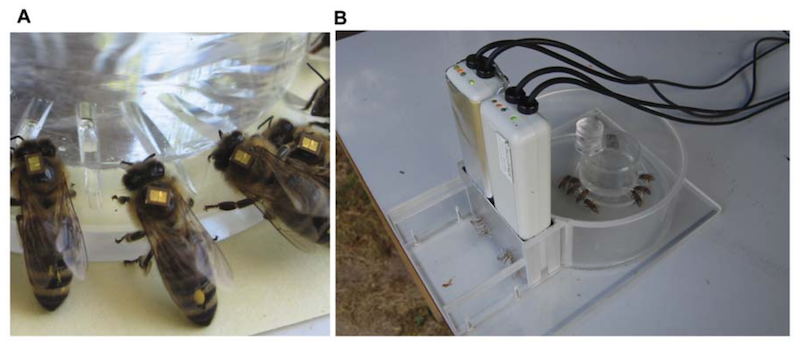
RFID tagged bees and RFID readers on a feeder
But an RFID chip that is about 2 mm2 is small enough to attach to the thorax of a bee and large enough to be relatively easy to detect … for example, when passing a reader at the hive entrance.
Flying home
How far do bees fly?
I’ve discussed this topic previously in a post titled Sphere of influence. Historically these studies were conducted by observing foraging activity in the badlands of Wyoming (where the bees had to fly miles to find anything), or by decoding the waggle dance to infer distances.
But let’s ask a slightly simpler question.
What is the furthest distance that a bee can successfully return to the hive from?
Just think about the practicalities of the experiment.
You could predict that the further away the bee starts, the less likely it would be to successfully return. In addition, the further away the start point, the longer it would take to return.
You’d therefore need to monitor lots of bees over a long time.
In addition, you’d need to be sure that the bees were not wind assisted, or – conversely – homing activity was similar irrespective of the direction the bee was initially transported.
So, more bees.
Time to chuck away those Posca pens and tag several hundred bees with RFID chips.
In 2011 Mario Pahl and colleagues did just that and published a study on the large scale homing of honey bees {{9}}.
Like all good experiments, the study is elegant and relatively straightforward. The paper is Open Access if you want to read it yourself … or keep reading for the juicy bits.
The key experimental details
Recently returned pollen-laden foragers {{10}} were captured, tagged with an RFID chip ‘emitting’ a unique serial number, placed in a black box, transported up to 13 km from the hive and released.
The hive entrance was fitted with an RFID receiver and the exact time the bee returned – if she returned 🙁 – was recorded.
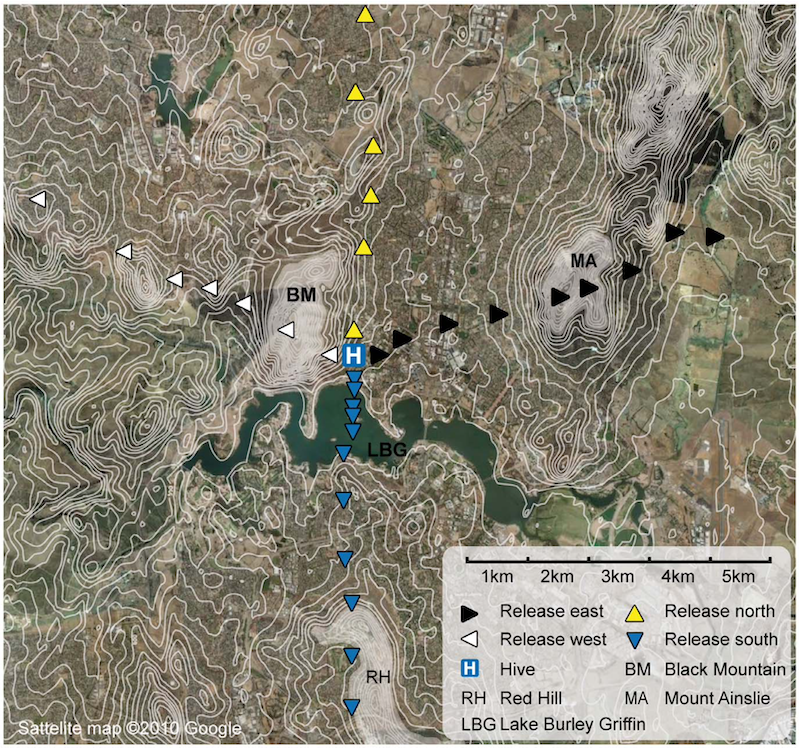
Map of the experimental area. Triangles mark release sites. Features discussed in text.
At least 20 bees were released in each of 33 different sites distributed to the north, south, east and west of the hive. The bees were transported to the release sites in black boxes so they could not get any positional information en route.
Anyone who transports bees (or cleared supers containing a few straggles) any distance will be familiar with their behaviour if/when you release escapees from the car. They spiral upwards in widening circles until they disappear from sight.
This is very similar to their behaviour on orientation flights. They are – literally – getting their bearings.
The ‘local’ landscape
It’s worth commenting here about the landscape features around the hive.
The experiment was conducted in Australia and the landscape around the hive was distinctive.
The hive was located 1 km east of Black Mountain (BM on the map above), 5 km north of Red Hill (RH {{11}} ) and about 4 km west of Mount Ainslie (MA). There was a lake (Lake Burley Griffin, LBG) immediately south of the hive {{12}}.

Panoramic view of the experimental area from the home hive.
There was good forage in the immediate vicinity (within 500 m) of the hive, including the Canberra National Botanic Gardens. The authors therefore thought it “unlikely, but not impossible, that the bees knew the areas beyond the lake, behind BM and beyond MA”.
I counted them all out, and I counted them all back {{13}}
Having released the bees they then decoded the unique tag numbers as the bees arrived back at the hive over the subsequent hours … and days.
The closer the release site, the more likely the bees were recorded returning to the hive. However, the homing rates – the percentage that returned for any given distance – were essentially the same for bees released to the north, south and west.
In these directions, no bees returned when released from much over 6 km distance.
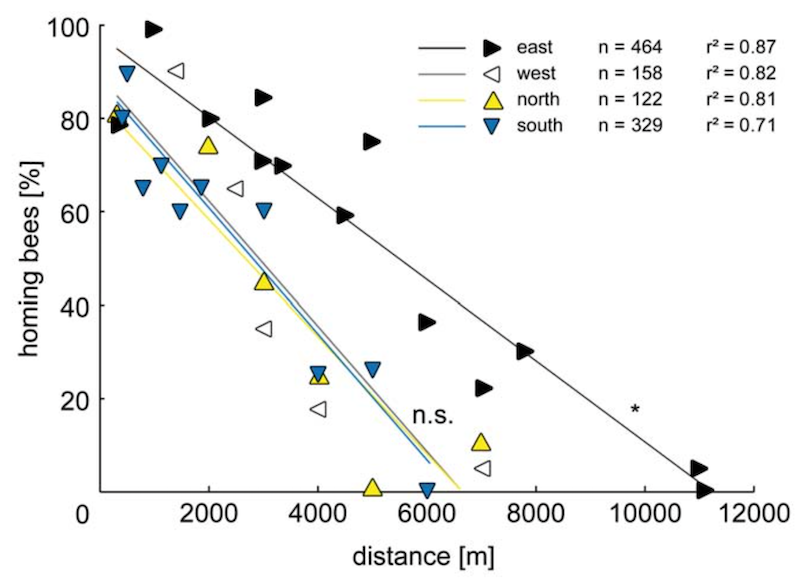
Homing rates. The percentage of bees that successfully returned from distant release points.
In contrast, bees transported up to 11 km east of the hive managed to return successfully.
This was not due to the prevailing wind direction which was from the north-east and about 15 km/hr, and would have therefore probably aided bees initially transported north as well.
Flight speeds
The homing speed – assuming the bees flew in a straight line – was about 25 m/min for bees released to the north, south and west, but significantly higher (35 m/min) for the bees released to the east.
Of course, the bees probably didn’t fly in a straight line {{14}}.
These speeds, when converted are only 1.5 – 2.1 km/hr. Honey bees can fly at up to 30 km/hr, but more typically fly at around half that speed.
At 15 km/hr all of the release sites were within an hour’s flight, indicating that a significant amount of time must have been spent searching for the correct bearing, rather than actually flying along that bearing.
The one exception to these flight times/speeds was for bees released on the opposite side of the lake. In this instance, flight times increased markedly despite the release sites being only 400 m apart. It is suggested that the bees minimised their flight over water by following the shoreline to the shortest crossing point in these instances.
Before moving on to the interpretation of the results it’s worth considering the numbers of bees studied, and the impossibility of doing this type of research without RFID technology.
1073 bees were tagged and released. Of these, a total of 394 returned (36%), though 75 of them (7% of released, 20% of returning) took more than 24 hours to find their way back to the hive.
Even the most dedicated PhD student would not be capable of doing this monitoring without the help of technology.
Why the longer and faster flights from the east?
Considering it likely that the bees only knew the area within a couple of kilometres of the hive, how could they find their way back from up to 11 km away, an epic journey that took several days?
And why did bees initially transported east return at both a higher rate and a higher speed?
It seems likely that for the short to medium release distances (say <4 km), the bees used the distinctive shape of BH to guide them back to the hive. Since this mountain was immediately adjacent to the home apiary the bees would be familiar with it.
Alternatively, since bees are known to sometimes exploit particular flight lines based upon underlying landscape features, the global landmarks such as BM and MA could guide the bees to the next path segment of the flight line.
That wasn’t the question though … the question was why was it only bees flying from the east that successfully returned from distances up to 11 km away?
Getting their bearings
Bees released east of MA could not ‘see’ the hive-adjacent BM (as MA is in the way). However, the authors suggest that – by flying west towards a high point on the skyline (which initially happened to be the mountain MA) – the bees could then “continue on to BM”, where the familiar local features then lead them home.
Whilst that makes some sense to me, it also makes an assumption that the bees somehow fly up and over {{15}} MA to get a view of BM. Without that view, what else entices them to fly further west?
Do lots of the bees ‘lost’ returning from the east actually end up expiring during their futile search for a hive immediately to the east of MA? The fact that these successful long journeys took ‘several days’ (the precise times are not indicated for individual bees) indicates that the bees obviously spent a long time searching.
There’s an additional conclusion that can be reached from these long-distance journeys. Not only would time have been spent flying and searching, but the bees would also have had to make refuelling stops. A full crop of syrup is only sufficient to keep a bee flying for 25 minutes, or about 7 km at a typical flight speed of 15 km/hr {{16}}. Therefore, the bees would have had to collect nectar several times on their journey.
So, what’s new?
In all honesty, not a lot.
The purpose of describing this study wasn’t because it unearthed some previously unknown details of the foraging or flight range of honey bees. Rather it was to introduce the concepts of uniquely tagged individual queen bees and using automated ‘readers’ to detect their movements.
It’s similar, but different, from the studies that involve uniquely barcoding bees I’ve described before.
Flight homing distances are considered a good indicator of the maximum potential foraging ranges. The figures determined using RFID-chipped honey bees are in broad agreement with the figures reported in previous analogue studies.
These place honey bees approximately mid-table in the league of ‘bee foraging distances’ … Ceratina smaragdula (a green metallic bee) goes no further than 200 m, whereas the South and Central American orchid bee Euplusia surinamensis boldly travels up to 23 km.
Some of the same authors applied this technique to investigate whether neonicotinoids were detrimental to the foraging behaviour of honey bees {{17}}. At high, but sub-lethal concentrations, foraging activity was reduced and foraging flight times increased. However, at field-relevant nectar and pollen concentrations no adverse effects were observed. This study used RFID readers at both the hive and the feeder to record additional features of the foraging flight that would not have been possible manually.
You’ll realise, from the first full paragraph of this section, that I’d meant to discuss studies on queen bee (orientation and mating) flights. As tends to happen, I got a little distracted by espionage, the first electronic musical instrument, the names of mountains and Posca pens, so the queens will have to wait until another time.
{{1}}: Roulston, T. H., Cane, J. H. (2000). The effect of diet breadth and nesting ecology on body size variation in bees (Apiformes). J. Kansas Entomol. Soc., 73(3), 129–142.
{{2}}: Don’t get me started or I’ll never get onto the topic of this post.
{{3}}: Sauthier, R., I’Anson Price, R. & Grüter, C. Worker size in honeybees and its relationship with season and foraging distance. Apidologie 48, 234–246 (2017).
{{4}}: Not so much lies, damn lies and statistics as just damn statistics.
{{5}}: You realise you only get 512 combinations if there is positional information considered as well
{{6}}: The plaque, and “The Thing”, were a gift from the Russians.
{{7}}: Cunning. At least, that’s what Google Translate Russian to English tells me is the right word. Interestingly, the American word appears to be D’oh!
{{8}}: Of necessity I’ve simplified this description quite a bit. RFID tags are big business and the technology is now fiendishly clever. There are even people walking about who have RFID tags embedded in their bodies (and I’m not referring to Bill Gates’s microchip Covid vaccine here).
{{9}}: Pahl M, Zhu H, Tautz J, Zhang S (2011) Large Scale Homing in Honeybees. PLoS ONE 6(5): e19669.
{{10}}: So definitely bees that had been on orientation flights and ‘knew the area’.
{{11}}: To my Australian readers … are all your hills named so imaginatively? I’m sure we name our Welsh hills and Scottish mountains a little less descriptively. Or perhaps we don’t.
{{12}}: And some of the release points were from a boat in the lake.
{{13}}: The late Brian Hanrahan, from 1982.
{{14}}: Or, if they did, they flew very slowly.
{{15}}: As opposed to Eddie Waring’s ”up and under”. Did you know that Eddie Waring was also responsible for the phrase “Going for an early bath” … originally a euphemism for being sent off for foul play?.
{{16}}: Hanauer-Thieser U, Nachtigall W (1995) Flight of the honey bee VI: energetics of wind tunnel exhaustion flights at defined fuel content, speed adaptation and aerodynamics. Journal of Comparative Physiology B: Biochemical, Systemic, and Environmental Physiology 165: 471–483. … which sounds like a paper on bee torture to me.
Join the discussion ...