Barcoding bees
Every jar of honey I prepare carries a square 20mm label that identifies the apiary, batch, bucket and the date on which is was jarred. The customer can scan it to find out about local honey … and hopefully order some more.
The label looks a bit like this:

Scan me!
This is a QR code.
You’ll find QR codes on many packaged goods in the supermarket, on bus stop adverts, on … well, just about anything these days. QR codes were first used in 1994 and are now ubiquitous.
QR is an abbreviation of quick response.
It’s a machine-readable two-dimensional barcode that is used to provide information about the thing it’s attached to.
QR codes contain positional and informational content. In the image above the three corners containing large squares allow the orientation to be unambiguously determined.
Within the mass of other, much smaller, black and white squares are several alignment points, an indication of the encoding {{1}} and the ‘information payload’.
Large QR codes can contain more information and more error correction (so they can be read if damaged {{2}} ). Conversely, small QR codes contain reduced amounts of information and less error correction, but can still be used to uniquely identify individual things in a machine-readable manner.
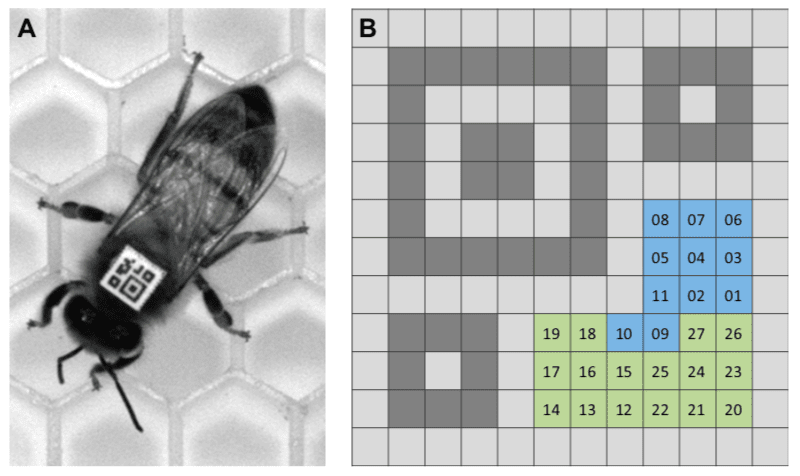
A barcoded bee and barcode diagram.
And those ‘things’ include bees.
I am not a number {{3}}
I had intended to write a post on how pathogens alter honey bee behaviour. This has been known about in general terms for some time, but only at a rather crude or generic level.
To understand behavioural changes in more detail you need to do two things:
- observe bees in a ‘natural setting’ (or at least as natural as can be achieved in the laboratory)
- record hundreds or thousands of interactions between bees to be able to discriminate between normal and abnormal behaviour.
And that isn’t easy because they tend to all look rather similar.
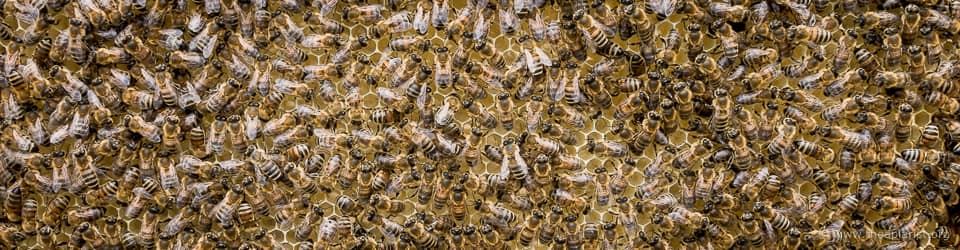
Lots of bees
How many of the bees above are engaging in trophallaxis?
Does the number increase or decrease over the next five minutes? What about the next hour?
And is it the same bees now and in an hour?
And what is trophallaxis anyway?
I’ll address the last point after describing the technology that enables these questions to be answered.
And, since it’s the same technology that has been used to monitor the behavioural changes induced by pathogens, I’ll have to return to that topic in a week or two.
Gene Robinson and colleagues from the University of Illinois at Urbana–Champaign have developed a system for barcoding bees to enable their unique identification {{4}}.
Not just a few bees … not just a couple of dozen bees … every bee in the colony.
Though, admittedly, the colonies are rather small 😉
Each barcode carries a unique number, readable by computer, that can be tracked in real time.
So, unlike Patrick McGoohan, these bees are a number.
bCode
The scientists designed a derivative of the QR code that could be printed small enough to be superglued to the thorax of a worker bee. They termed these mini-QR-like codes bCodes {{5}}. The information content of a bCode was limited by its size and the reference points it had to carry that allowed the orientation of the bee to be determined.
In total the bCode could carry 27 bits of data. Eleven bits (each essentially on or off, indicated by a black or white square) encoded the identification number, allowing up to 2048 bees to be uniquely numbered. The remaining 16 bits were the error-correction parity bits that had to be present to ensure the number could be accurately decoded.
If you’re thinking ahead you’ll realise that the maximum number of bees they could therefore simultaneously study was 2048. That’s about 1/25th of a very strong colony at the peak of the season, or the number of bees covering both sides of a two-thirds full frame of sealed brood.
It’s enough bees to start a one frame nucleus hive, which will behave like a mini-colony {{6}} and, in due course, expand to be a much larger colony.
And if you’re thinking a long way ahead you’ll realise the every barcode must be affixed to each bee in the same orientation. How otherwise would you determine whether the bees were head to head or abdomen to abdomen?
Labelling bees
This is the easy bit.
Each bCode was 2.1mm square and weighed 0.6mg i.e. ~0.7% of the weight of a worker bee. Honey bees can ‘carry’ a lot more than that. When they gorge themselves before swarming they ingest ~35mg of honey.
The bCode therefore should not be an encumbrance to the bee (and they confirmed this in an exhaustive series of control studies).
A single frame of sealed brood was incubated and the bees labelled within a few hours of emergence. Typically, two batches of ~700 bees each were labelled from a single frame for a single experiment.
Each bee was anaesthetised by chilling on ice, the bCode glued in place (remember … in the same orientation on every bee) and the bee allowed to recover.
Labelling a single bee took 1-2 minutes.
Labelling 1400 bees takes several people a long time.
I said it was easy.
I didn’t say it was interesting.
Smile for the camera
I’ve not yet discussed the goal of the study that needed barcoded bees. It’s not really important while I’m focusing on the technology. Suffice to say the scientists wanted to observe bees under near natural conditions.
Which means a free-flying colony, on a frame of comb … in the dark.
Free-flying because caged bees do not behave normally.
On a frame of comb because they were interested in the interactions between bees under conditions in which they would normally interact.
And in the dark because that’s what it’s like inside a beehive (and it’s one of the features that scout bees favour when selecting a site for a swarm).
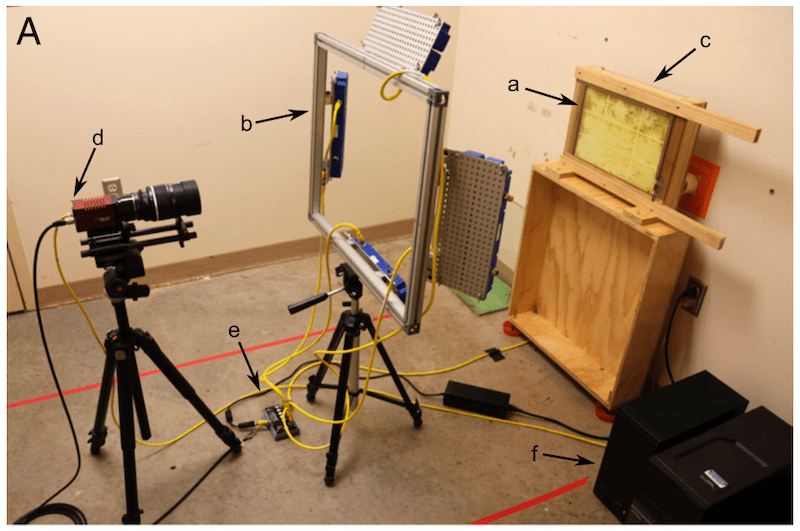
Camera and hive setup.
The scientists used an observation hive with a difference. It had an entrance to allow the bees to fly and forage freely and it contained a single sided, single frame. In front of the frame was a sheet of glass separated by 8mm from the comb. This prevented the bees from clambering over each other, which would have obscured the bCodes {{7}}. Behind the frame was an 850nm infrared lamp to increase contrast, and the front was illuminated by several additional infrared lamps.
Bees cannot see light in the infrared range, so they were effectively in the dark.
The camera used (an Allied Vision Prosilica GX6600 … not your typical point and shoot) recorded ~29MP images every second. A typical experiment would involve the collection of about a million images occupying 4-6 terabytes of hard drive space {{8}}.
The recorded images were processed to determine the temporal location of every bee with a visible (and readable) bCode. This was a computationally interesting challenge and involved discarding some data – e.g. barcodes that moved faster than a bee can walk or barcodes that fell to the bottom of the hive and remained motionless for days (i.e. dead bees). About 6% of the data was discarded during this post-processing analysis.
Trophallaxis
Which finally gets us to the point where we can discuss trophallaxis.
Honey bees and other social insects engage it trophallaxis.
It involves two insects touching each other with their antennae while orally transferring liquid food. It occurs more frequently than would be required for just feeding and it has been implicated in communication and disease transmission.
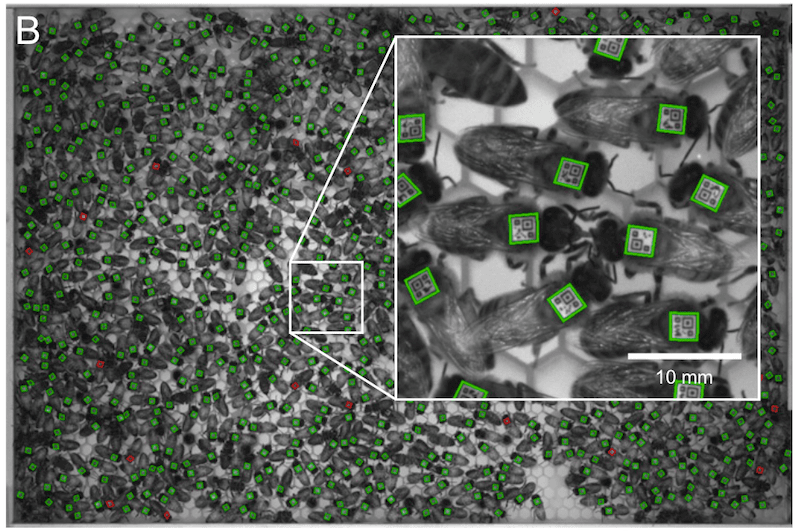
bCoded bees and trophallaxis
So, if you are interested in trophallaxis, how do you determine which bees are engaging in it, and which are just facing each other head to head?
In the image above the two bees in the center horizontally of the insert {{9}} are engaged in trophallaxis. The others are not, even those immediately adjacent to the central pair.
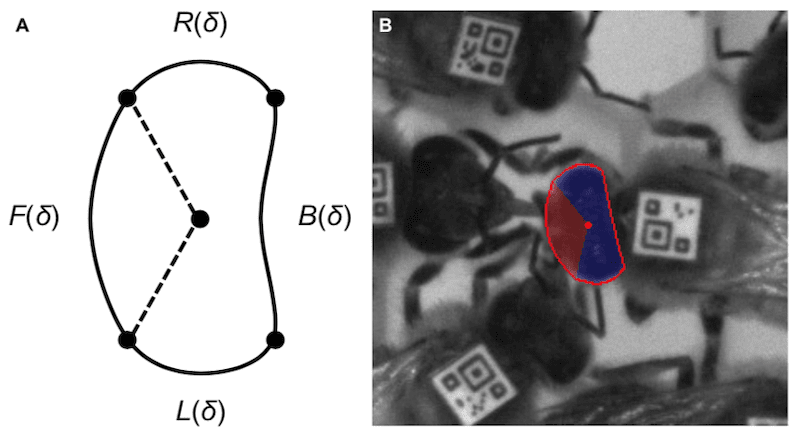
Image processing to detect trophallaxis – head detection.
This required yet more image processing. The image was screened for bees that were close enough together and aligned correctly. An additional set of custom computer-vision algorithms then determined the shape, size, position and orientation of the bees’ heads. To be defined as trophallaxis the heads had to be connected by thin shapes representing the antennae or proboscis.
And when I say the image … I mean all million or so images.
Bursty behaviour
And after all that the authors weren’t really interested in trophallaxis at all.
What they were really interested in was the characteristics of interactions in social networks, and the consequences of those interactions.
This is getting us into network theory which is defined as “Well out of my depth”.
Transmission of things in a network depends upon interactions between the individuals in the network.
Think about pheromones, or honey, or email … or Covid-19.
It’s only when two individuals interact that these can be transmitted between the individuals. And the interaction of individuals is often characterised by intermittency and unpredictable timing.
Those in the know – and I repeat, I’m not one of them – call this burstiness.
If you model the spread of ‘stuff’ (information, food, disease) through a bursty human communication network it is slower than expected.
Is this an inherent characteristic of bursty networks?
Are there real bursty networks that can be analysed.
By analysing trophallaxis Gene Robinson and colleagues showed that honey bee communication networks were also bursty (i.e. displayed intermittent and unpredictable interactions), closely resembling those seen in humans.
However, since they had identified every trophallaxis interaction over several days they could follow the spread of ‘stuff’ through the interacting network.
By simply overlaying the real records of millions of interactions over several days of an entire functional community with an event transmitted during trophallaxis they could investigate this spread..
For example, “infect” (in silico) bee 874 in the initial second and follow the spread of the “infection” from bee to bee through the real network of known interactions.
In doing this they showed that in a real bursty network, interactions between honey bees spread ‘stuff’ about 50% faster than in randomised reference networks.
Why isn’t entirely clear (certainly to me {{10}}, and seemingly to the authors as well). One obvious possibility is that the topology of the network i.e. the contacts within it, are not random. Another is that the temporal features of a bursty network influence real transmission events.
Scientists involved in network theory will have to work this out, but at least they have a tractable model to test things on …
… and at a time when some remain in lockdown, when others think it’s all a hoax, when social distancing is 2m {{11}}, when some are wearing masks and when prior infection may not provide protective immunity anyway, you’ll appreciate that ‘how stuff spreads’ through a network is actually rather important.
Stay safe
{{1}}: Numeric, alphanumeric, byte/binary, and kanji
{{2}}: Or can be customised to contain additional graphics …
{{3}}: I am not a number, I am a free man, Number Six (Patrick McGoohan) in The Prisoner, 1967
{{4}}: See Gernat et al., (2018) Automated monitoring of behavior reveals bursty interaction patterns and rapid spreading dynamics in honeybee social networks. Proc. Natl. Acad. Sci. USA 115:1433-1438.
{{5}}: See what they did there?
{{6}}: Other behavioural studies have confirmed that small colonies ‘behave’ like large colonies.
{{7}}: Though they could walk on the glass, so ‘hiding’ their bCodes … about 4% of bees did this.
{{8}}: That’s quite a lot of data, though it’s not the petabytes the physicists and atom smashers generate. This part of the study was done in 2013 when a typical high-end desktop computer would have a 1Tb hard drive.
{{9}}: Left and right of the central four bCodes.
{{10}}: No surprises there.
{{11}}: Or is it 1m, or 1.5m?
Join the discussion ...