Counting Varroa
It’s that time of the season again. With the exception of readers in the Southern Hemisphere, Colonsay, the Isle of Man or a few favoured locations in the Highlands of Scotland†, miticide treatments should be on to reduce Varroa levels.
For reasons explained elsewhere, it’s important that this is done before the winter bees are exposed to the smorgasbord of viruses that Varroa transmits when it feeds.
It’s not sufficient to just treat. You also need to have some idea that the treatment is reducing the numbers of Varroa in the colony.
Counting by numbers
It has been determined that only 10-20% of mites in a colony are phoretic i.e. attached to emerged workers‡. The majority of treatments (MAQS is the current exception) only target these mites. Therefore, treatments are usually applied over a period of several weeks to ensure that mites newly emerged from capped cells are also exposed.
There are a couple of obvious ways to determine the mite load before and after treatment. These include:
- conducting an alcohol wash test, or a sugar-roll equivalent, of workers to quantify the phoretic mites.
- uncap a known amount of worker brood (drone brood is almost certainly absent from colonies this late in the season) to quantify mite infestation.
However, both are pretty intrusive and – with the exception of the sugar-roll – involve the sacrifice of bees or brood, so perhaps not ideal at this stage of the season. However these are the most accurate way of measuring things.
Counting the corpses
Out, damn’d mite …
Alternatively, and this is what most beekeepers do, apply the treatment and count the mite drop.
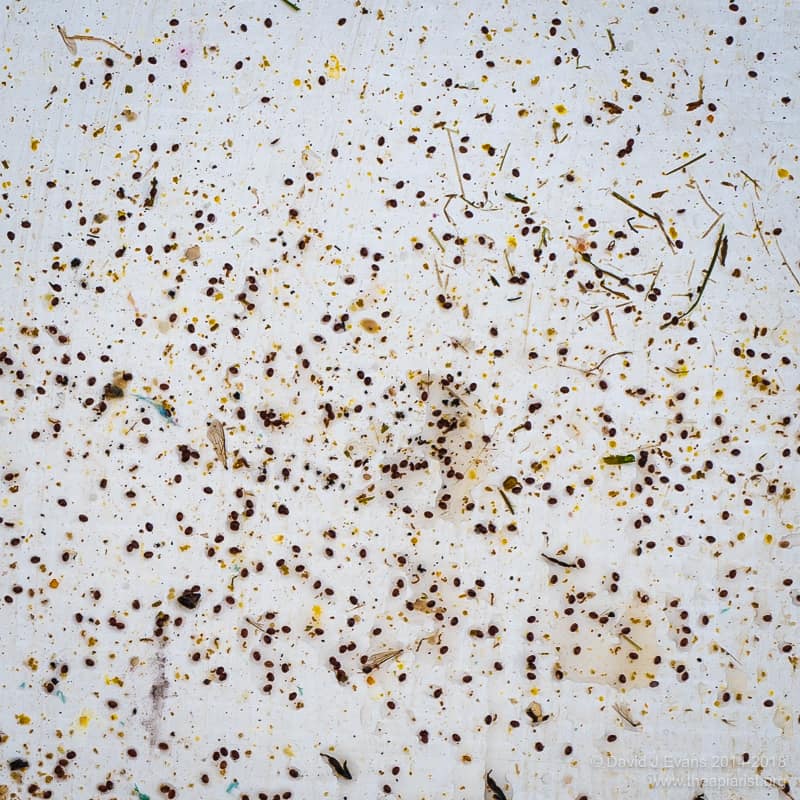
To count the mites you need some way of catching the mites. Open mesh floors (OMF) can easily be fitted with a sheet of closely-fitting (most usefully white) Correx onto which the mites drop. Restrict the access of ants and other creepy crawlies to the tray or they may steal some of the corpses. Check these on a regular basis during treatment and you have a simple way of determining whether the treatment is working.
The treatment may be working, but has it been effective?
The scores are on the floors
If you count thousands of dropped mites and that number doesn’t diminish during treatment i.e. the drop per day early and late in treatment is broadly similar, then the treatment is working, but it’s not effective or finished as there are loads of mites still left.
What you need to observe is a reduction in mite drop when comparing early and late counts.
Depending upon the treatment, the first days’ drop isn’t necessarily indicative of whether the miticide is working (or of the phoretic mite load of the colony). It may take a day or two for the treatment to achieve maximum kill. Vaporised oxalic acid often gives a better drop after 24-48 hours, and continues to work over about 5 days.
As indicated in the footnote‡, the numbers of brood emerging per day will expose ‘new’ mites to the miticide, increasing the count. If emerging brood levels vary, so will the mite drop … but also remember that the efficacy of the miticide also varies over time.
What you’re looking for is a hugely reduced count of mites dropped per day at the end of the full treatment period when compared with the beginning.
I usually carefully monitor the first week or two and the last week. Simples.
Objective vs. subjective counting
Easy counting …
Some beekeepers count each and every mite that appears on the trays. Others just look for ‘lots’ at the beginning and ‘almost none’ at the end. I consider >50/day is ‘lots’ and only count smaller numbers.
The less frequently you count the more difficult it is to discriminate dead mites from all the other detritus that accumulates on the trays. The cell cappings, the pollen that’s being dropped, the wax scales and various other bits of bee, all make spotting the mites more tricky.
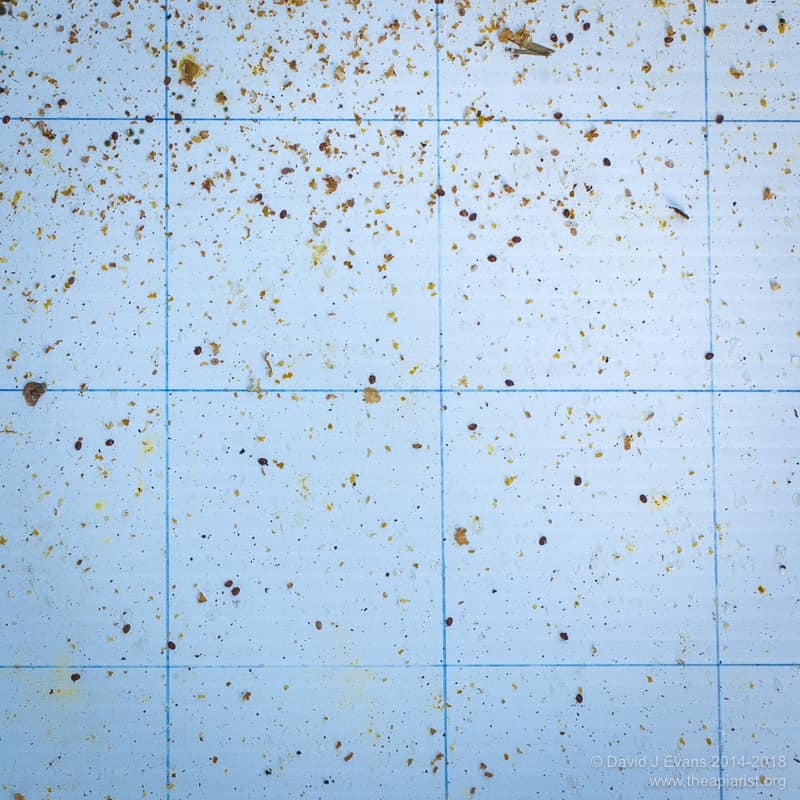
The larger the area you’re counting the more likely it is to either double-count or miss mites. Make life a bit easier by ruling a simple grid onto the tray and counting square by square.
Scrape the tray clean after counting the mites … if you leave the tray dirty you’ll end up double counting and struggling to spot mites that are knee-deep in the crud that’s fallen through the OMF.
Don’t try this at home
Varroa are a pretty regular size and shape. And colour for that matter. At least adult mites are. This raises the possibility – though perhaps only to those with a tendency towards geekiness – to try and count mites automagically§.
Rather than stand around the apiary squinting through myopic eyes at tiny reddish ovals you could simply photograph the tray and then process the image later.
Been there, done that … or at least tried to.
Fiji …
There’s a freely-available, well-supported, image analysis package called ImageJ (also distributed sometimes as the auto-referential Fiji … Fiji is just ImageJ). It’s possible to count objects using ImageJ having set criteria that define them.
As an exercise in near-futility I’ve attempted to do this for Varroa. You first need to ensure the Varroa are of a standardised size and shade by scaling the image appropriately and correcting the colour. This can be done by using a photographers grey card of a known size, placed to the side of the Varroa tray. You then use this as a reference to scale the image and define the white balance.
Finally, you define the size, roundness and shade of a Varroa and process the image in ImageJß. It counts the mites and provides an overlay with each identified mite numbered. You’re then able to check whether it’s missed any.
It does.
Consistently variable
This is the point I’ve got stuck at … the accuracy is all over the place but it’s clearly not impossible. Problems include:
- It overlooks mites lying on their ‘edges’, perhaps propped up on a speck of pollen or fragment of wax. Better colour definition and a wider range of ‘ovality’ might sort this out.
- It misses mites lying immediately next to another mite – these look like 8 or ∞ rather than a simple solid oval. I’ve no clear solution to this other than counting lower densities of mites.
- It ignores some mites that appear as ‘doughnuts’ because of reflection from the shiny carapace. Don’t use flash for the photography.
- It counts some ovalish, reddish lumps of pollen that are about the right size as mites. D’oh!
At best the accuracy is above 80%, but it’s variable. The lack of consistency is the major issue. If it was always 80% it would be perfectly acceptable and a very fast way to record mite numbers. At worst – usually when the tray is messy and mite numbers are relatively low – it’s well below 50%.
This is an intriguing beekeeping-related task for long winter nights. If you’re a geek. My ambition is to take a quick smartphone photo, scrape the Correx tray clean and then (automagically!) do the counting at home with a cup of tea and piece of cake.
I’ll keep persevering … particularly with the tea and cake 😉
† It’s currently Spring in the Souther Hemisphere, so the wrong time to treat. The remaining locations (and Australia) have no Varroa so have no need to treat. Lucky blighters.
‡ This is a gross oversimplification. Obviously, a broodless colony will only have phoretic mites. Swarms that issue from colonies take 35% of the mites with them, leaving 65% on the remaining bees (or capped in cells). The actual number of phoretic mites likely depends upon the prior history of egg laying by the queen. It also is probably influenced by the overall level of mites in the colony (or ratio of uncapped brood to mites perhaps). I’m not sure if anyone has modelled this successfully, though it might be possible to do this with BEEHAVE.
§ Automagically is pretty obviously a concatenation of automatic and magic. It is usually defined as “(especially in relation to the operation of a computer process) automatically and in a way that seems ingenious, inexplicable, or magical”. Interestingly, the term was first used in the 1940’s, well before the advent of computers.
ß Once I’ve got this working better I’ll provide some instructions … in the meantime the menus that you need to use are Analyse … Set Measurement and Analyse … Count Particles. Image scaling needs to be done first in ImageJ. Currently I do the white balance in Adobe Lightroom (which is overkill, but convenient as all my images go through this software).
Join the discussion ...