Time to BEEHAVE
I’ve been dabbling with BEEHAVE, a computer simulation of a honeybee colony. It’s not beekeeping, but it’s about as close as you can get in the middle of winter. BEEHAVE was developed by Matthias Becher in the University of Exeter and the paper that describes the model is published and Open Access.
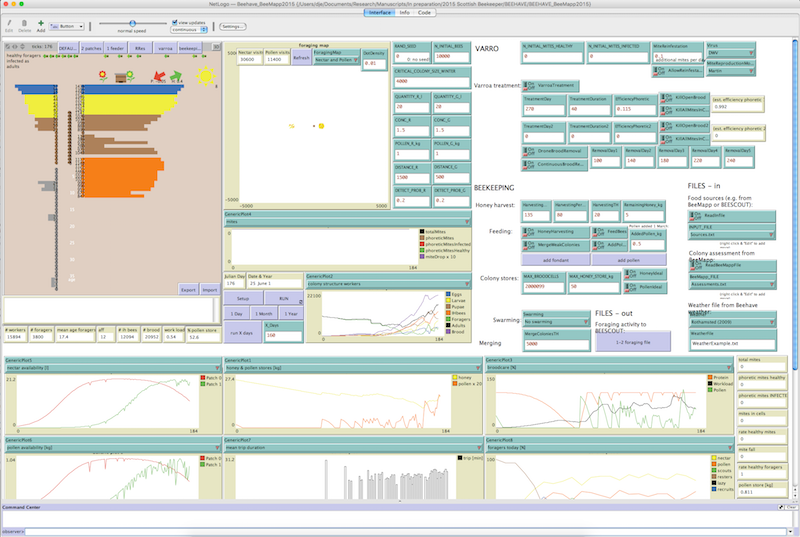
BEEHAVE …
The model includes a wealth of user-modifiable variables such as forage availability, climate, beekeeping activities and pathogens, and outputs information on colony size, speed of development, age structure, honey stores etc. The BEEHAVE simulation is implemented in the open source language NetLogo and is freely available. The parameters that influence colony development – egg laying rate, drone/worker ratios, forage (nectar and pollen) availability, mite replication rate etc. are all based on measured and published data (or logically extrapolated from this if they don’t exist) so that the in silico performance is a fair reflection of what might be expected in the field.
If you can, do … if you can’t, simulate it 🙂
I’m interested in the rational and effective use of miticides to control Varroa-mediated transmission of DWV (and other viruses) in the hive. Using BEEHAVE and a standardised set of conditions allows predictions to be made of how effective a particular Varroa control might be. For example, here’s a simple question we can try and answer:
How important is a midwinter mite treatment if you’ve treated earlier in the year?
Using BEEHAVE set to all the default conditions and ‘priming’ the colony with just 20 mites on the 1st of January it’s possible to see what happens if no treatments are applied over one or more years. It’s then possible to repeat the predictions with the inclusion of a Varroa treatment. For the purpose of this brief introduction to BEEHAVE I’ve used a miticide which is applied and active for a total of 28 days and which kills 95% of phoretic mites. This might broadly reflect Apiguard treatment (2 x 14 days) or vaporised oxalic acid (OA; 3 treatments at 5 day intervals, but documented to kill mites for up to one month). I’ve additionally looked at the application of a single treatment with oxalic acid in midwinter, again killing 95% of phoretic mites, the sort of effect that OA trickling might achieve if there’s no brood present.
No treatment … they’re doomed
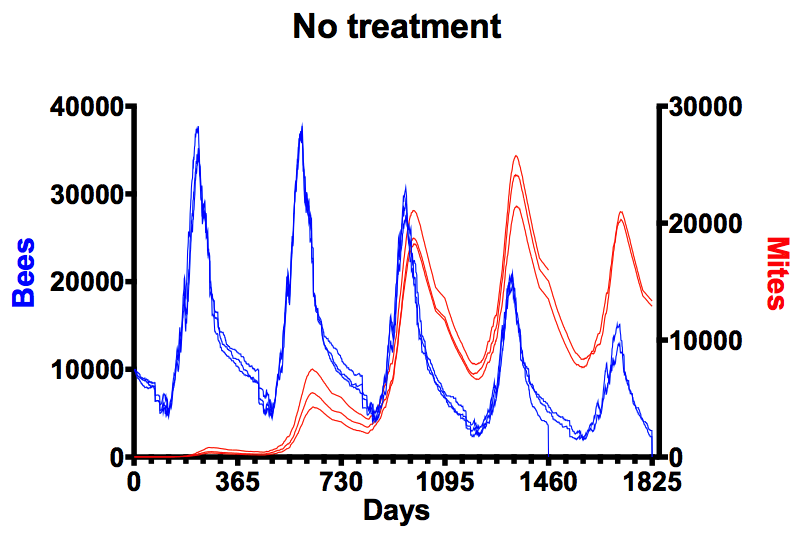
No treatment
BEEHAVE modelling is based on a series of underlying probabilities (e.g. likelihood of a developing pupa to become mite associated, likelihood of that being a drone or worker pupa) so doesn’t produce the same results every time it is run¹. For example, the graph above shows adult bee numbers (left axis, blue lines) in an untreated colony for three simulations of up to five years each (horizontal axis), together with the associated mite number (right axis, red lines). Mite number build up strongly as new brood is reared each spring, with mite numbers peaking at ~24,000 in the fourth summer. In the third and fourth winters mite number per bee range from 2-4. The default conditions of 20 mites, coupled with a minimum viable colony size of 4000 bees, results in one colony succumbing in the fourth winter and the two remaining dying in the fifth winter (bee numbers drop to zero). Real studies – with untreated hives in the field – have shown similar outcomes though colonies tend to die between winters 2 and 3, presumably because the input mite populations are higher². In all subsequent graphs the data plotted is the average of three simulations.
One treatment … better than nothing
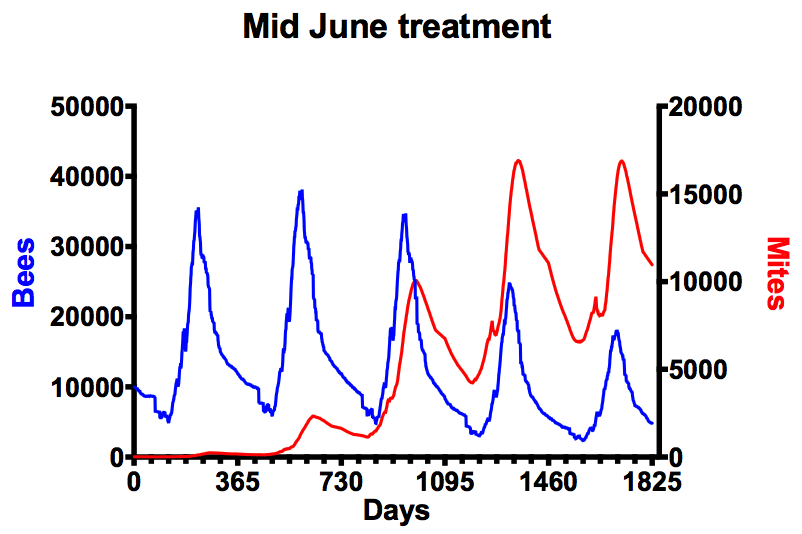
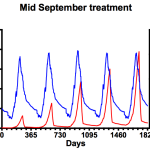
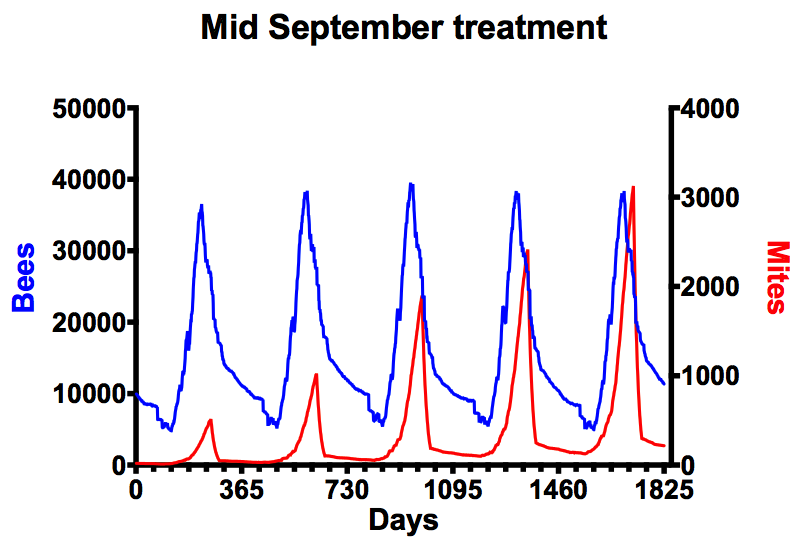
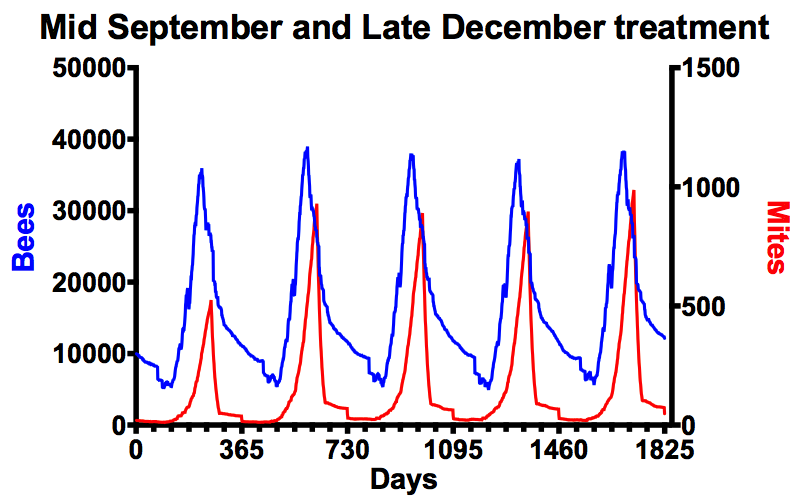
It’s worth remembering at this point that the advice from the National Bee Unit is that mite numbers in the colony should be maintained below 1000. To try and achieve this we need to investigate the influence of applying miticides in the simulation – in mid-June (left graph), mid-September (middle) or late December (right). I appreciate mid-June is very early in the season, but it emphasises an important point.
-
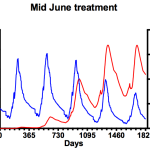
- Mid June treatment …
-
- Late summer mite treatment and no midwinter treatment.
-
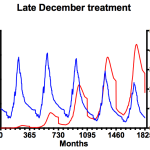
- Late December
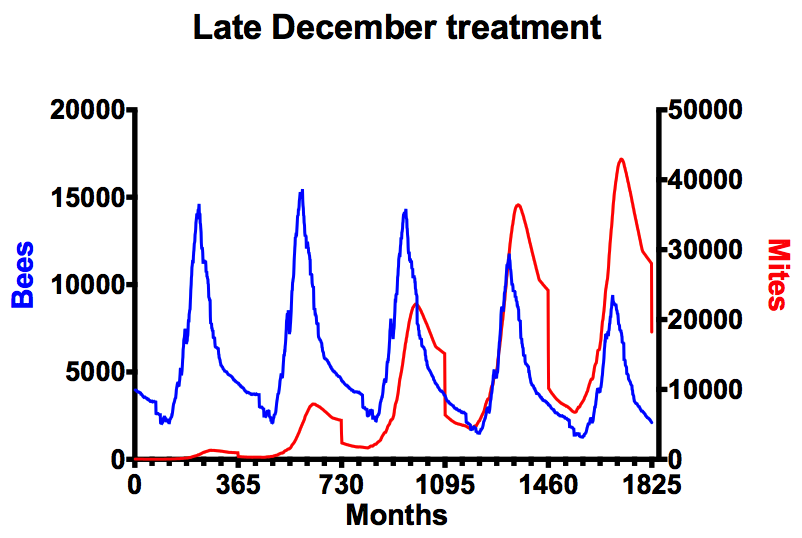
That’s a bit better 🙂 These plots show the averages of adult bee and mite numbers (using the format shown above, blue for bees, red for mites). None of the in silico colonies expired during the simulation though the mite numbers are dangerously high irrespective of the treatment during the mid/late summer months. Note that range of the scale on the right hand (mite numbers) axis differs in each graph. Treatment in mid-June (left) delays the summer exponential rise in mite numbers and, in terms of overall impact on mite numbers (and consequent adult bee losses) is measurably better than only treating in midwinter (right). Of the conditions tested, mid-September (centre) is clearly the best … Varroa levels are reduced at the same time as the colony starts to contract, leaving the remaining mites less opportunity to reproduce. Maximum colony size remains about the same year on year and Varroa numbers never reach more than one third of those seen in either mid-summer or midwinter treatments. However, not everything is rosy … Varroa levels are dangerously high from the third summer on, and levels are increasing each winter. Remember that these simulations were started with just 20 mites in the colony².
Do your colonies have only ~20 mites in them this winter?
Two treatments … a double whammy
Two optimal treatments
It’s only when you combine early autumn and midwinter treatments that mite numbers are really well controlled. Under the highly optimised conditions – both treatments were set to be 95% effective against phoretic mites – Varroa numbers remain below the NBU recommended maximum of 1000 for the duration of the simulation. Clearly the combination of the mid-September slaughter of phoretic mites, coupled with a midwinter mopping up – when there’s little or no brood present – provides really tight control of Varroa levels. However, the importance of this is perhaps even more apparent when you consider the consequences of a sub-optimal mid-September treatment.
-
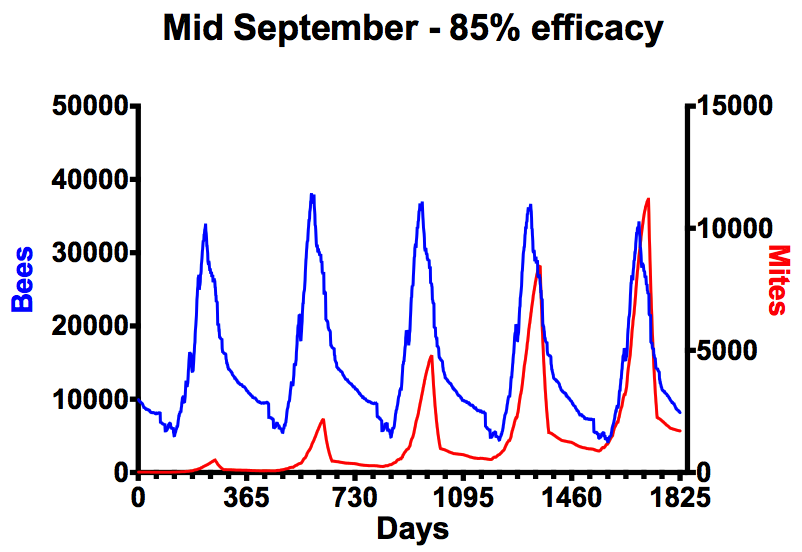
- One 85% treatment
-
- Two treatments
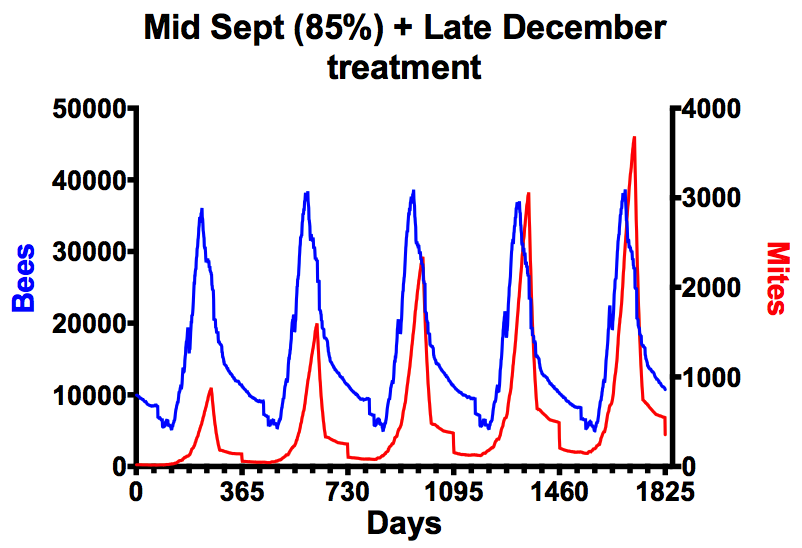
The graph on the left shows the consequences of using a miticide that achieves only 85% efficacy … perhaps reflecting Apiguard usage when the ambient temperature is too low for the thymol to be spread throughout the colony. Under these conditions mite numbers rapidly get out of control. Compare that with the graph on the right which includes an additional midwinter treatment where mite numbers are far better controlled … though only to about the same level as is seen with a 95% knockdown of mites in mid-September (centre graph in the ‘one treatment only’ section, above).
And the answer is …
Occupied bait hive …
Although the majority of miticides are broadly similar in their maximum published efficacy, I suspect that they are often used in a way or under conditions that do not routinely achieve these maxima. For example, the 30 year average September temperature in England is just below 13°C, much lower than the temperatures in which Apiguard efficacy reached the reported maximum of 99%, and lower than the Vita-recommended minimum temperature (15°C). Therefore, the answer to the original question (which was How important is a midwinter treatment if you’ve treated earlier in the year?) is … if there’s any chance the late summer/early autumn treatment was sub-optimal then a midwinter treatment is very important to prevent Varroa levels building up in the colony, resulting in the spread of virulent strains of DWV and other viruses. The other broad conclusion is that miticides are much more effective – in terms of impact against the total mite population – when brood levels are low or absent. That’s why brood breaks coupled with miticide treatments e.g. applying vaporised oxalic acid to a recently hived swarm or one that has moved in to a bait hive, are a very powerful combination to reduce the impact of mites, and the viruses they transmit, on the colony.
There are additional considerations which influence the choice and timing of miticide treatments. In a future post I’ll address the timing of the autumn treatment and the critical development of the overwintering bees that get the queen and the colony through to the following Spring.
¹BEEHAVE provides the ability to model colony development based upon measured and measurable parameters within a honeybee colony. Of course, in the real world a host of factors influence our bees – climate, forage availability, bad beekeeping, good beekeeping, integrated pest management, swarming, queen longevity etc. These are all variable within BEEHAVE but have been left unaltered from the defaults for the purpose of this post in which only the timing and efficacy of miticide treatment was altered. All the data for this post were generated using the rather verbosely numbered BEEHAVE_BeeMapp2015 version.
²Mite levels were deliberately started at a very low level to emphasise how quickly they build up if not controlled. Running the simulations with a higher mite input simply shifts all the graphs to the right e.g. increasing input mites to 200 (not an unreasonable number for many midwinter colonies) with no treatment, results in the virtual colony dying in early December of the third year, with mite levels having reached ~5300 in the first summer and ~19000 in the second.
This is the second in a series of related posts about Varroa control. The first was on drifting in honeybees. I’ve created a separate page that lists these and other posts on the how, why and when of Varroa treatment.
Join the discussion ...