Going the distance
I’m going to continue with a topic related to the waggle dance this week.
This is partly so I can write about the science of how bees measure distance to a food source.
But it’s also to encourage those who didn’t read the waggle dance post to visit it. Weirdly it was only read by about 50% of the usual Friday/weekend readership and I suspect (from a couple of emails I received) that the weekly post to subscribers ended up in spam folders {{1}}.
If you remember, the duration of the waggle phase of the dance – the straight-line abdomen-wiggling sashay across the ‘dance floor’ – indicates the distance from the nest to the desirable food source {{2}}. The vigour of the wiggle indicates the quality of the source.
How do bees measure distance?
Karl von Frisch, the first to decode the waggle dance, favoured the so-called ‘energy hypothesis’. In this, the distance to a food source was determined by the amount of energy used on the outbound flight.
Does that seem logical?
If correct, foragers would only be able to determine the energy used after their second trip to a food source. This presumes their first trip was longer as they searched the environment for something worth dancing about {{3}}.
This would be an easy thing to test, though I’m not sure it was ever investigated {{4}}.
As it happens, far better brains determined that the energy hypothesis was probably incorrect. Many of these studies explored how gravity influences the distances reported by dancing foragers.
Going up!
Bees use more energy when flying up. For example, when flying from ground level to the top of a tall building, when compared to level flight. Similarly, they use more energy flying if they have small weights attached to them {{5}}.
A series of experiments, nicely reviewed by Harald Esch and John Burns {{6}}, failed to provide good support for the energy hypothesis. There were lots of these studies, involving steep mountains, tall buildings or balloons, between the 1950’s and mid-80’s.
Interesting science, and no doubt it was a lot of fun doing the experiments.
For example, bees flying to a sugar feeder situated on top of a tall building dance to ‘report’ the same distance as bees from the same hive flying to a feeder at ground level adjacent to the same building.
Similarly, foragers loaded with weights do not overestimate the distance to a food source, as would be expected if the energy expended to reach it was being measured {{7}}.
Interesting and entertaining science certainly, but none of it providing compelling support for the energy hypothesis
It’s notable that there is a rather telling sentence from the Esch & Burns review that states “While reading the original papers, one gains the impression that evidence supporting the energy hypothesis was favored over arguments against it”.
Ouch!
Splash landing
Although Von Frisch was a supporter of the energy hypothesis {{8}} he also published a study that provided evidence for our current understanding of how bees measure distance.
Bees generally don’t like flying long distances over water. Von Frisch provided two equidistant nectar sources, one of which was situated on the other side of a lake.
On very calm days the bees that flew across the lake under-reported the distance to the feeder. This underestimate was by 20-25% when compared to bees flying to an equidistant feeder overland.
Von Frisch commented “the bee’s estimation of distance is not determined through optical examination of the surface beneath her”.
He assumed that the mirror-like water surface provided no optical input as it contained no visual ‘clues’. After all, one calm patch of water looks much like any other. Von Frisch used this as an argument for the energy hypothesis.
He also noted that the bees generally flew very low over the water surface, often so low that they drowned 🙁
Perhaps these bees were flying dangerously low to try and find optical clues.
Such as their height above the surface?
Or perhaps the distance travelled?
Going with the flow
Having debunked the energy hypothesis, Esch & Burns proposed instead the optic flow hypothesis. This states that “foragers use the retinal image flow of ground motion to gauge feeder distance”.
Imagine optic flow as tripping a little odometer in the bee brain that records distance as her eyes observe the environment flashing past during flight. The clever thing about that is that the environment is variable. It’s not like counting off regularly spaced telegraph poles from a train window.
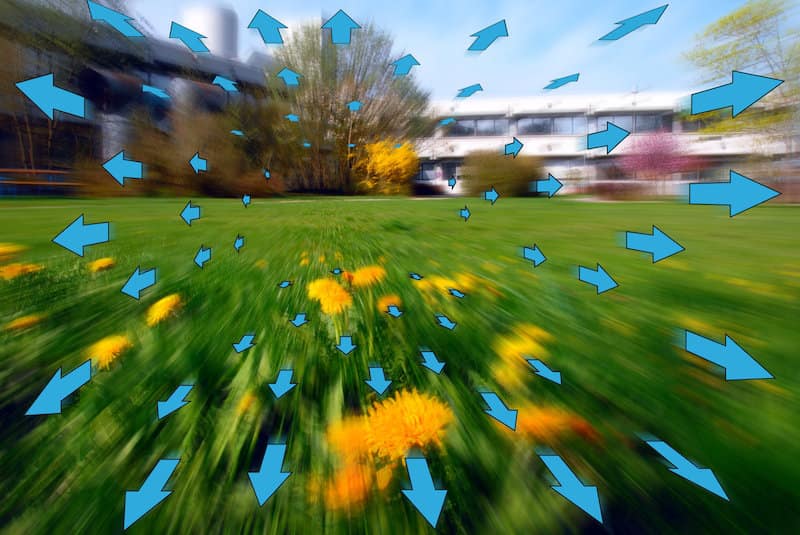
When flying, environmental objects that are nearby will move across her vision much faster than distant objects. Bees don’t have stereo vision, but instead use this speed of image motion to infer range.

Optic flow – the arrow size indicates the speed with which the object apparently moves, and hence its range
Esch & Burns returned again to tall buildings to provide supporting evidence for their optic flow hypothesis. They trained bees to fly between two tall buildings with 228 metres separating the hive and the feeder {{9}}.
Returning foragers reported that the food source was only 125 metres away.
However, the bees didn’t make a direct flight. Instead they flew at altitude for 30-50 metres, descended to fly much lower, then ascended again to approach the feeder again at altitude.
The interpretation here was that the high altitude flight provided insufficient optic flow to measure distance. The bees descend to get the visual input needed to judge distance, but it’s only for part of the flight … hence leading to under-reporting the distance separating the hive and feeder.
Tunnel vision
Jurgen Tautz {{10}} and colleagues trained bees to forage in a short, narrow tunnel {{11}}. This elegant experiment provided compelling support for the optic flow hypothesis.
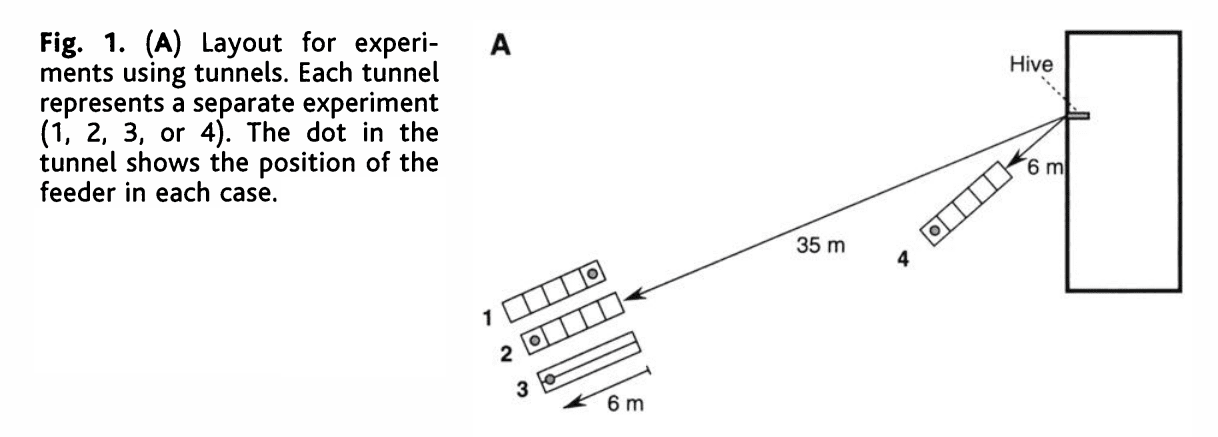
The tunnel was ~6 m long and with a cross sectional area of ~200 cm2 – big enough for a bee to fly along, but sufficiently narrow so that the bee would be closer to the ‘walls’ than in normal free flight. The walls and floor of the tunnel had a random visual texture. Only the end of the tunnel facing the hive was open.
These studies were conducted when the terms round and waggle were used to distinguish the dance induced by food sources <50 m and >50 m respectively from the hive {{12}}. Rather than emphasise the shape of the dance I’ll just describe it as a >50 m or <50 m waggle dance.
‘Tunneling’ bees misreport distances
In the first tunnel experiment (1) the feeder was 35 m from the hive. 85% of dances indicated the feeder was <50 m away. However, when the feeder was moved to the opposite end of the tunnel (2) – still only 41 m from the hive – 90% of the dances indicated the feeder was >50 m away.
To test how the random pattern influenced the perceived distance the scientists used a third tunnel (3) lined with lengthwise stripes. In this instance – despite the feeder position being unchanged from experiment 2 – 90% of the dances indicated the feeder was <50 m away.
The stripes were predicted to ‘work’ in the same way as the smooth lake surface, providing no visual clues.
In the fourth experiment (4) the feeder was 6 m along a randomly patterned tunnel, which was placed just 6 m from the hive. Over 87% of dances indicated that the feeder was >50 m away.
Interpreting the waggle run
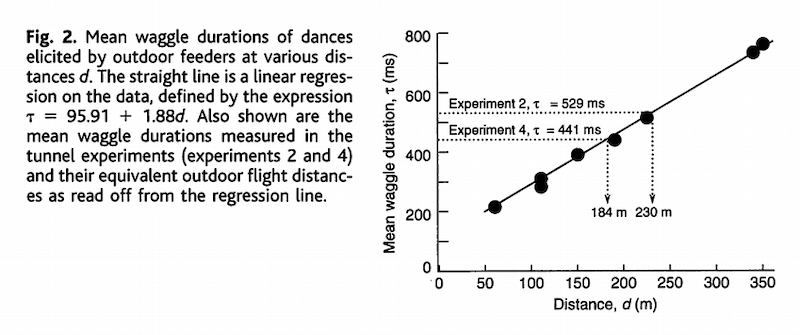
In open flight {{13}} there is usually an excellent correlation between the duration of the waggle run and the distance to a feeder (see the graph below {{14}} ). By extrapolation, the bees in experiments 2 and 4 ‘thought’ they had flown 230 m and 184 m respectively. In reality they had flown only 41 m and 12 m in these experiments.
How could the bees get it so wrong?
Increased optic flow
Tunnel-traversing bees fly just a few centimeters away from the visible ‘environment’.
As a consequence, at the same flight speed, they experience greater optic flow.
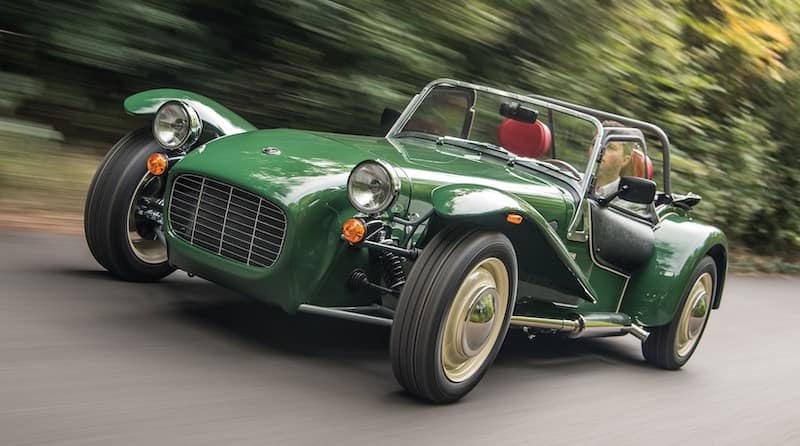
If, instead of driving around in your lumbering old van, you pack your hive tool in a Caterham 7 for the trip to the apiary you’d be well aware of what I mean.
30 mph in a Toyota Hilux feels very much slower than 30 mph in a Caterham 7. This is largely because visual reference points, like the broken white lines between lanes in the road, appear in and disappear from your field of view much faster … because you’re much closer to them.
Because the tunnel dimensions were known it was possible to calculate the calibration of the bee’s odometer. Classically this would be defined in terms of metres of distance flown generating a particular waggle run length or duration.
These tunnel studies demonstrate that distance flown is not what calibrates the odometer. Instead it’s quantified indirectly in terms of the image motion experienced by the eye. Since environments vary the way to express this is the amount of angular image motion that generates a given duration of waggle.
And, using some mathematical trickery we don’t need to bother with {{15}}, it turns out that this angular motion is only dependent upon distance flown, not the speed of flight.
This is important. Headwinds or tailwinds could change the speed of flight, but not the distance flown {{16}}.
It’s all relative
It’s worth emphasising that the dance followers in experiments 2 (above) should still find the feeder.
The waggle dance would ‘instruct’ them to fly 230 m at the bearing indicated and they’d experience the same visual clues en route.
This means that they should still enter the narrow tunnel and experience increased optic flow because of the encroaching walls. But they’d be experiencing the same optic flow the initial dancing bee had experienced, so would not attempt to fly further down the tunnel.
This means that the optic flow experienced is context dependent. It is related to the environment the bees are foraging in.
This makes sense as the dancing bees and dance followers all occupy the same environment.
How do we know this? {{17}}
Changing the environment
If we change the environment the dance followers search at the wrong distance.
I qualified the statement above when I said that the dance followers should still enter the tunnel and find the feeder.
Actually, most recruits will miss the tunnel entrance – remember it’s smaller that a sheet of A5 paper. At 35 m distance a bee would have to get the bearing correct to about 0.16° to enter the tunnel {{18}}.
So the bees that do not enter the tunnel experience a different environment.
Where do they search for the feeder?
They search at the distance indicated by the waggle duration … so bees that missed the tunnel entrance in experiment 2 (above) would have searched for the feeder 230 m from the hive. Similarly, the dance followers in experiment 4 would have searched 184 m away {{19}}
Context dependent dance calibration
And, finally, the calibration of the odometer depends upon the environment.
If the environment experienced by the dancing bee en route to the feeder in experiments 2 and 4 is different, then it generates a different relationship between waggle run duration and distance.
For example, if one feeder was across a closely mown lawn and the other was across dense shrubby woodland, they would each generate a unique optic flow, so changing the image motion experienced, and hence the waggle run generated.
In the diagram above, you shouldn’t use dance calibration for bees trained to direction A to determine the distance bees going in direction B would forage.
Phew!
Optic flow, waggle dancing and implications for practical beekeeping
None 😉
At least, none that I can think of.
A Caterham 7 isn’t an ideal car for a beekeeper but would be a lot of fun to help you understand optic flow 😉
Most of us keep our bees in mixed environments. Your apiary isn’t situated with a cliff edge on one side and an unbroken prairie on the other. Since the environment is mixed, the waggle dance calibration is not going to be wildly different, whichever way the bees fly off in. You can therefore use an approximate figure of 1 second per kilometre to estimate the the distance at which your bees are foraging, irrespective of the direction they go.
Notes
Most of the referenced studies are at least two decades old. Honey bees have remained a fertile research tool for neurobiologists. Our understanding of honey bee vision continues to improve. However, I cannot discuss any of these more recent studies with reference to optic flow. Anyway, just because they’re old doesn’t make the experiments any less elegant or interesting 🙂
{{1}}: Wordpress may have changed the email ‘headers’ so your spam filters thought it wasn’t authentic. It was. It’s the only email you should receive from this website each week. If this happened, you can avoid this in the future by adding the ‘from’ address to your address book. If the problem continues (please tell me!) – it’s an automagic (but flawed) feature of WordPress – I’ll abandon it and switch to a Mailchimp-type weekly newsletter if I have to. Tragically, I’m a subscriber to my own blog, so I try to identify these problems in advance but it doesn’t always work that way. On average I’ve posted once a week for over 6 years, with Friday posts very week for three years … if it doesn’t appear email me, or look out for my obituary.
{{2}}: I’m going to focus here on nectar, but the waggle dance for nectar, pollen, water and new nest sites is fundamentally the same.
{{3}}: It’s known that only good sources lead to vigorous dancing – for example, a strong sugar syrup is much more likely to promote dancing than a weak syrup.
{{4}}: I’ve not read the original papers (which were in German). In addition, I’ve simplified the energy hypothesis considerably for two reasons; 1) Variants of this hypothesis included integration and averaging of energy used for both outbound and inbound flight, and 2) I want to discuss distance estimation when flying around obstacles in a future post …
{{5}}: Yes, seriously.
{{6}}: Esch & Burns (1996) Distance estimation by foraging honeybees. J. Exp. Biol. 199:155-162.
{{7}}: Actually, that’s not entirely true … this experiment was done in the 1960’s by Von Frisch and thought to support the energy hypothesis. However, attempts to repeat it in the 1980’s failed. An experiment that cannot be independently repeated cannot be considered a trustworthy result.
{{8}}: And a contributor to it … he did the a study on weightlifting bees.
{{9}}: Esch & Burns (1995) Honeybees use optic flow to measure the distance of a food source. Naturwissenschaften 82:38–40.
{{10}}: Author of the excellent The Buzz About Bees: Biology of a Superorganism.
{{11}}: Srinivasan et al., (2000) Honeybee Navigation: Nature and Calibration of the “Odometer”. Science 287:851-853.
{{12}}: Subsequent studies suggest that they are just different forms of the same dance, the waggle dance, as described previously.
{{13}}: i.e. outside the confines of a tunnel.
{{14}}: Usually, but not always, as I shall describe in a minute.
{{15}}: Which might mean “that is more than my brain can cope with”.
{{16}}: Subsequent studies have shown that bees use optic flow to maintain flight speed, allowing them to compensate for headwinds and tailwinds – more on this in a future post.
{{17}}: Other than it’s pretty darn obvious?
{{18}}: Warning … I discarded the envelope I did that calculation on the back of. It might be a little bit wrong. Or a lot.
{{19}}: See Esch et al., (2001) Honeybee dances communicate distances measured by optic flow. Nature 411:81–583. Note that I’ve described these results in terms of the initial optic flow study referenced above. It actually used tunnels and feeders at opposing compass points.


Join the discussion ...