Survival of the fattest
Winter bees have high levels of vitellogenin, a glycolipoprotein {{1}}, deposited in their fat bodies which act as a food reservoir for the long winter.
These fat winter bees are essential for the successful overwintering of the colony.
Last week I discussed the major points that need attention for overwintering i.e. strong, healthy colonies with ample food in a weathertight hive.
This week I want to explore the relationship between colony strength, health – specifically with regard to Varroa and deformed wing virus (DWV) – and isolation starvation.
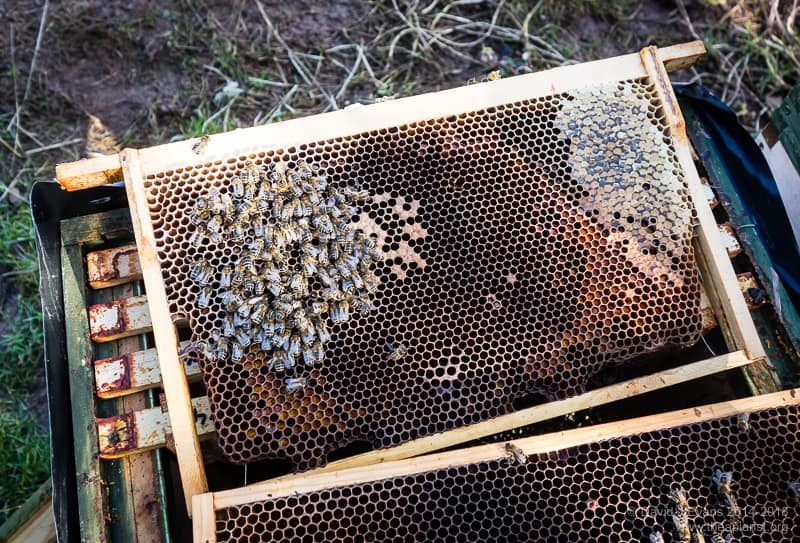
Isolation starvation describes the phenomenon where a small colony of tightly clustered honey bees gets isolated from the honey stores laid down in autumn, resulting – typically during protracted cold periods – in the colony starving to death.
It’s both a pathetic and distressing sight. Bees, with their heads crammed into the bottom of cells searching for food, dying from starvation when literally inches away from capped stores.
Deaths and births
In temperate climates the winter is characterised by low temperatures and little or no forage for the bees. The queen usually stops laying sometime in autumn and starts again around the turn of the year. During the intervening period she may lay intermittently, but generally in limited amounts.
The fat bodied winter bees that are reared in late summer and early autumn are long-lived (about 6 months) and are responsible for getting the colony through the winter. They protect the queen, thermoregulate the hive and they help rear the brood raised in the autumn and through the winter.
In their absence – or if there are just too few of them – the colony will perish.
Winter bees do not all live for 6 months. The usual figure quoted is ~175 days {{2}}. Some live shorter lives, some longer … up to 9 months under certain conditions.
Importantly, in studies I’ve discussed at length previously, high levels of DWV reduces the lifespan of winter bees. We know this because, in Varroa-infested colonies, researchers {{3}} have shown that the winter bees die off faster {{4}}.
Live fast, die young
Winter bees with high levels of DWV don’t really live fast … but they do die young. In the studies above the average lifespan of winter bees was reduced by 20% in the colonies that died overwinter.
There are a couple of important things to note here. Dainat and colleagues were not looking at bees in the presence or absence of Varroa, or in the presence or absence of high or low levels of DWV. They simply looked at hives that succumbed in the winter or that survived, then measured DWV and Varroa levels. It’s a subtle but important difference. Their surviving colonies still had Varroa and DWV.
From analysis of hives that died or survived, and having marked known numbers of bees in late summer, they could determine the life expectancy of workers – in their surviving colonies it was ~88 days, in those that died it was ~71 days.
Healthy colonies
The gradual death of bees through the winter coupled with the reduced lifespan of winter bees with high levels of DWV explains why colonies need to be strong and healthy.
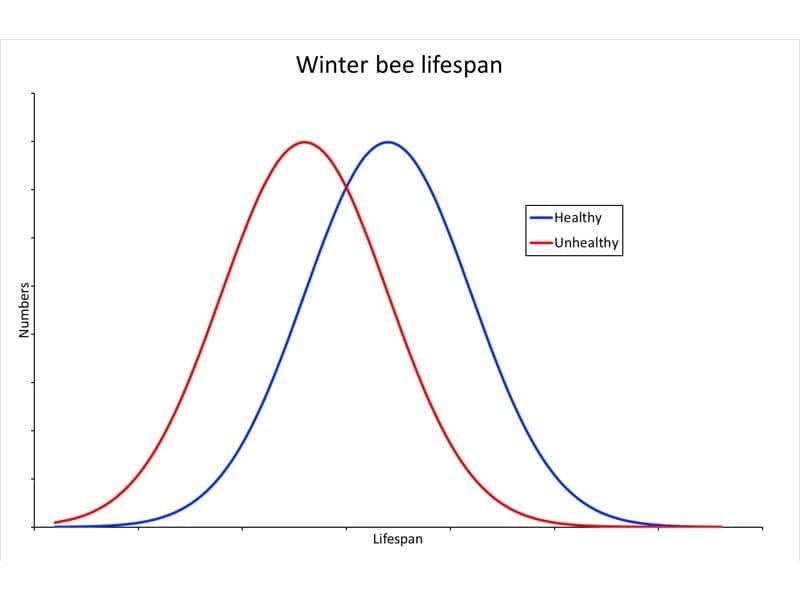
The following graphs are based upon modelled data {{5}}, but show the influence of colony size and winter bee lifespan.
The first graph – the least important – simply shows the lifespan of bees. The graph plots the number of bees (on the vertical axis) in a population that die at a particular time (on the horizontal axis) after the start of the experiment. The blue bees have a longer average lifespan than the red bees {{6}}.
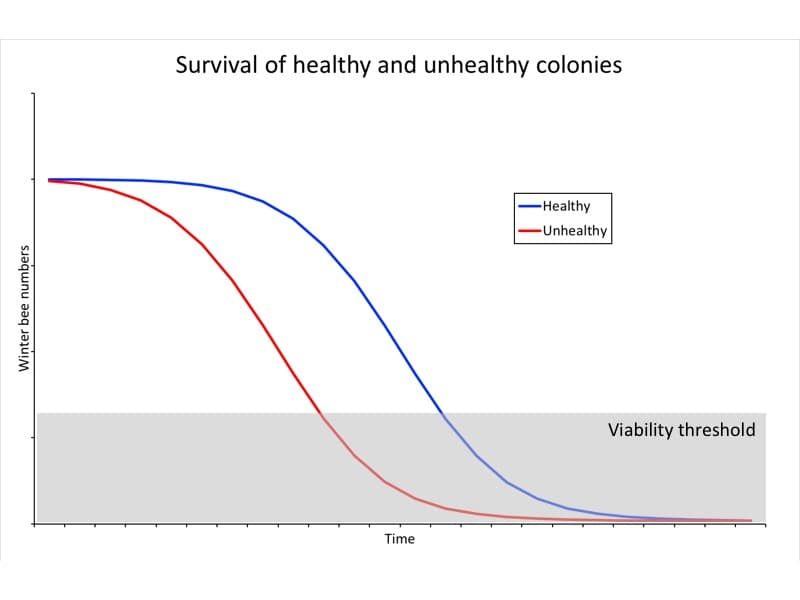
In the following graphs remember that the blue bees are healthy, with low levels of Varroa and – consequently – low levels of DWV. The red bees are unhealthy and have high levels of Varroa and DWV.
Using this lifespan data we can look at the influence on the total number of winter bees in a colony (on the vertical axis) over time (horizontal). Imagine that the horizontal axis is the long, dark, wet and cold months of winter. Starting in early September and running through until late March.
Brrrr ?
It is clear, and of course entirely predictable, that the numbers of bees in the healthy (blue) colony are higher than those in the unhealthy colony at each time point. If the average lifespan is reduced (by disease) more bees will have died by a particular time point when compared with a healthy colony at the same timepoint.
Finally, consider that the shaded section of the graph represents the lower limit of bee numbers for viability. If the number of bees in the colony drops into this region the colony will perish.
Simplistically – and in reality – starting with similar numbers of bees a healthy colony will survive longer than an unhealthy colony.
Strong colonies
Using a similar approach we can also look at the influence of the average lifespan of winter bees on the survival of strong or weak colonies.
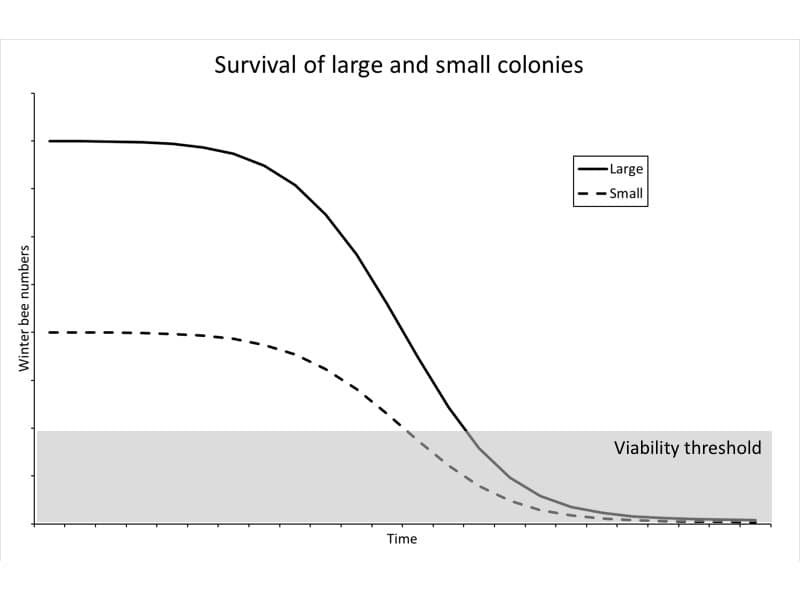
The following graph shows the numbers of bees in the colony over time for a strong colony (solid line) and a weak colony (dashed line) where worker bee lifespan is identical {{7}}.
The shaded section of the graph again represents colony oblivion.
Large (strong) colonies take longer to drop below the threshold for viability and so – all other things being equal – will survive longer {{8}}.
Mix’n’match
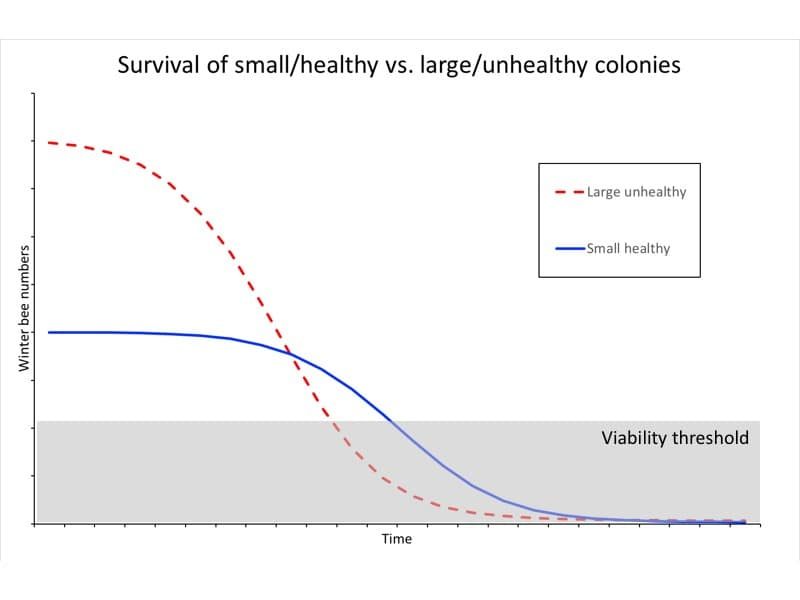
A strong colony with high levels of Varroa and DWV might actually survive less well than a weak but healthy colony.
In this graph the weak but healthy colony drops below the ‘viability threshold’ after the strong but unhealthy colony {{9}}.
Winter bees and brood rearing
This is modelled data, but it makes the point clearly. Large and/or healthy colonies retain more of the all-important winter bees and so survive longer.
Simples.
The differences might not appear marked. However, for convenience {{10}} I’ve omitted the influence of winter bee numbers on the ability of the colony to rear brood.
If there are more winter bees, the colony is able to thermoregulate the hive better. It’s therefore able to keep any brood present warm. It’s therefore able to rear more brood.
As a consequence, the differences in bee numbers between the large or small, or the healthy and unhealthy, colonies will be much more striking.
Critically {{11}} the strength of the colony coming out of the winter is often the rate-limiting determinant for spring build-up to exploit early season nectar flows. Weak colonies develop less well.
Isolation starvation
Finally, returning to that pathetic little cluster of starving bees in the image at the top of the page. What is the relationship between colony health, strength and isolation starvation?
It’s now time to dust off my weak-to-non-existent Powerpoint skills …
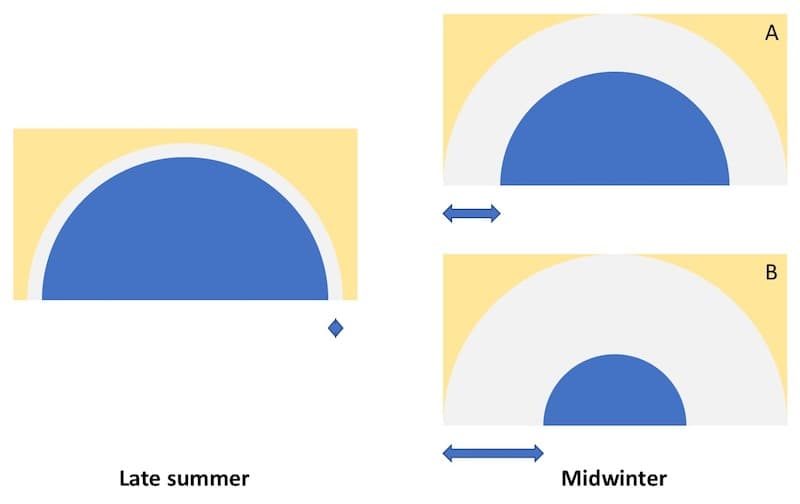
Again, it’s straightforward. A large (strong) overwintering colony (A above) only has to move a short distance to access stores in midwinter. In contrast, a small (weak) overwintering colony has to move much further.
Consequently, small colonies become isolated from their stores during long, cold periods when the colony is clustered.
Prediction
Many beekeepers will be familiar with isolation starvation of overwintering colonies.
Most would explain this in terms of “very cold weather and the cluster was unable to reach its stores”.
Some would explain this in terms of “the colony was far too small to reach the stores when clustered”.
Very few would explain this in terms of “the Varroa and DWV levels were too high because of poor disease management last autumn. Inevitably most of my winter bees died off early in the winter, leaving a very small cluster of bees that were unable to reach the stores.“.
I suspect the real cause of isolation starvation is probably disease … specifically poor management of Varroa levels and consequently high levels of DWV in the colony.
Colophon
Herbert Spencer
Another post, another poor pun in the title. Survival of the fittest encapsulates the Darwinian evolutionary principle that the form of an organism that survives is the one able to leave the most copies of itself in future generations. Darwin didn’t actually use the term until the 5th edition (1869) of his book On the origin of the species. Instead, the phrase was first used by Herbert Spencer in 1864 after reading Darwin’s book. Whilst ‘survival of the fittest’ suggests natural selection, Spencer was also a proponent of the inheritance of acquired characteristics, Lamarckism.
{{1}}: A protein (-protein) with properties of both sugar (glyco-) and fat (-lipo-).
{{2}}: This figure is from Remolina & Hughes, 2008 Age 30:177, citing papers going back to the 1930’s.
{{3}}: Dainat et al., 2012 Dead or alive: deformed wing virus and Varroa destructor reduce the life span of winter honeybees App. Environ. Microbiol. 78:981-987.
{{4}}: See also van Dooremalen C et al. (2012) Winter Survival of Individual Honey Bees and Honey Bee Colonies Depends on Level of Varroa destructor Infestation. PLoS ONE 7: e36285.
{{5}}: By which I mean I’ve not actually measured anything, but instead have simply dabbled with the statistics functions in Excel. In comparison to lab or field studies these are very easy and inexpensive ‘experiments’ to conduct.
{{6}}: I’ve modelled a normal distribution but, in reality, it’s probably not normal but is instead skewed left – with a longer tail on the left than the right.
{{7}}: Which explains why there are no red or blue lines here.
{{8}}: Also see the note below on brood rearing. These graphs do not make allowances for any new bees reared during the time being analysed.
{{9}}: Don’t try this at home … just because I can model a small healthy colony surviving longer than a large unhealthy one does not mean it’s something to aspire to. Or even something that might occur. The purpose of this post is to encourage you to prepare strong and healthy colonies for winter.
{{10}}: … and laziness and because I’m pretty inept at using the statistical functions in Excel.
{{11}}: And to be discussed in a future post.
Join the discussion ...