Too many honey bees (in town)?
Synopsis : Honey bees compete with native bees. How many hives are too many, resulting in damage to native bee populations? Probably fewer than you think.
Introduction
Several years ago I visited Montréal to speak at an international symposium. It was a big conference with a very busy programme but I still managed to sneak away and see the city. We had a week or so of stunning Indian summer weather so I walked almost everywhere; along the banks of the St Lawrence and Prairies Rivers, through the Botanic Gardens and the Mount Royal {{1}} Park.
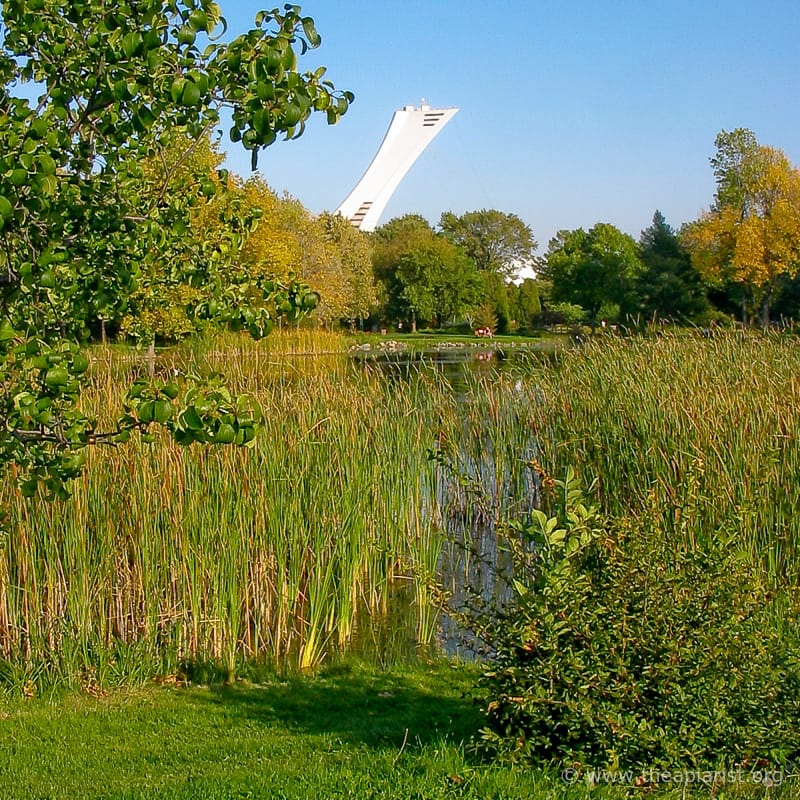
Montréal Olympic stadium from the Botanic Gardens
If you’ve not been I can recommend it.
However, I didn’t see a single honey bee.
I wasn’t specifically looking for honey bees, but beekeepers tend to notice these things.
In retrospect that wasn’t too surprising. At that time there were just a couple of hundred hives within the city, which covers an area of 430 km2 .
I did see monarch butterflies (Danaus plexippus) in the gardens, stocking up on nectar before starting their migration back to Central Mexico.
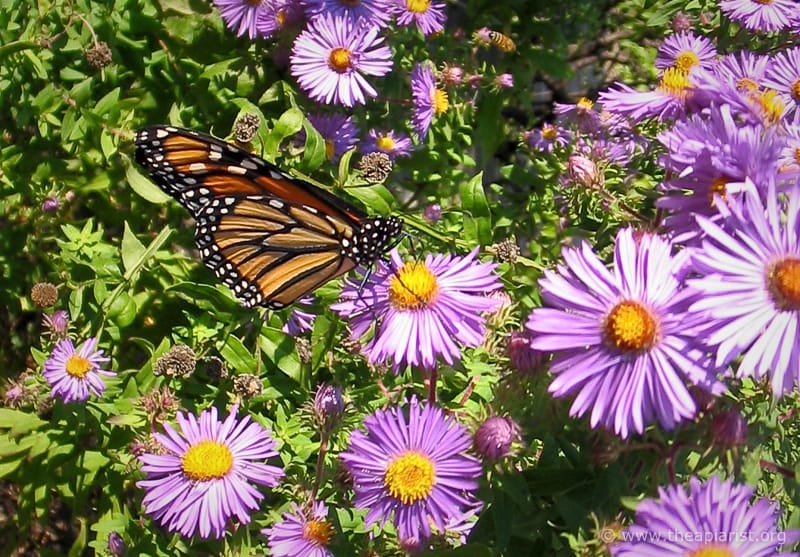
Monarch butterfly, Montréal Botanic Gardens
This was early October. Had there been lots of honey bees in Montréal I’d have expected to see them on the same asters, competing for the nectar with the butterflies, piling in the stores before the coming winter.
And competition isn’t always a good thing.
Save the bees
Scientists have long been aware of the importance of pollinators (many of which are insects) and the global decline of insect populations. The role of insects, and the importance of conserving them can be a difficult thing to ‘sell’ to the general public.
They are often perceived as wriggly, creepy-crawlies, that might sting … urgh!
Without public support many conservation projects will fail.
Increasing public awareness and associated conservation measures, for example banning pesticide sales by garden centres, is needed and a combination of ‘brand awareness’, a widespread fondness for honey and (inevitably) sloppy journalism means that honey bees (Apis mellifera) have become the poster girl for insect pollinators.
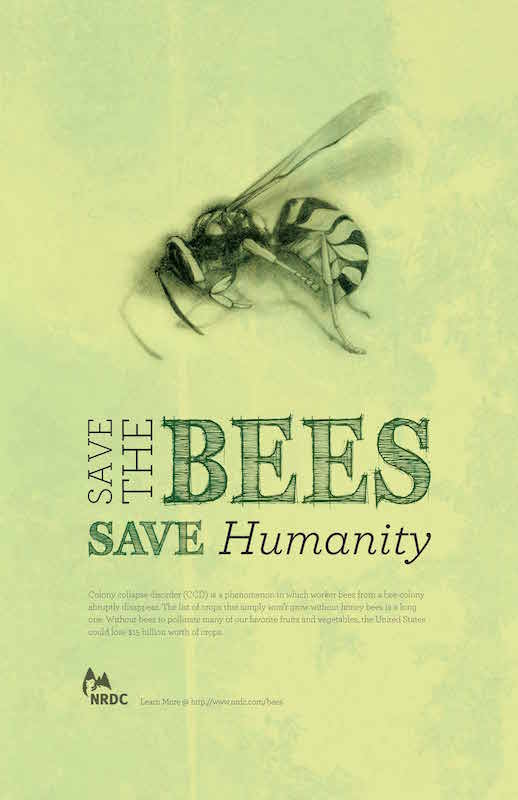
Save the bees …
’Save the bees’ as a slogan is a gross oversimplification of ’increase the number and diversity of insects pollinators in the environment’ and is usually taken to mean – or interpreted as – ‘promote honey bees’.
If you’re interested in seeing just how biased this coverage is I recommend Smith and Saunders (2016) who collated press articles on pollinators (in Australia) and quantified the different species featured. The title of their paper neatly defines the problem:
Honey bees: the queens of mass media, despite minority rule among insect pollinators
The beekeeping ‘explosion’
Partly as a consequence of this media coverage there has been an explosion of interest in honey bees and beekeeping over the last 10-15 years … and lots of new beekeepers.
Since over 80% of Canadians live in urban areas a significant proportion of these new beekeepers – and their hives – are in towns and cities.
Between 2013 and 2020 the number of hives in Montréal increased from 283 to ~3000.
Conveniently – for this post and the paper (MacInnes et al., 2023) on which it is primarily based – there was an extensive survey of Montréal’s urban bees in 2013 (Normandin et al., 2017). By repeating the survey in 2020 it was possible to determine the impact of the increase in urban honey bees on wild bees and some of the flowers on which both depend for pollen or nectar.
This ‘before and after’ study showed that the introduction of large numbers of hives reduce wild bee species richness and pollen availability.
“Too many honey bees” … perhaps not what you expected in a beekeeping blog 😉 .
Testable hypotheses
The MacInnes study had three goals, to:
Examine the species richness and composition of wild bee communities along a gradient of honey bee abundances
Assess the influence of honey bee abundance on floral resource (pollen) availability
Compare the richness and composition of the wild bee communities before and after the large increase in the honey bee colonies in Montréal
The 2918 hives in Montréal are not evenly distributed {{2}}. The location of some were known, but in the absence of that information it has to be inferred by the frequency of honey bees sampled in particular locations … if there are lots of honey bees it’s reasonable to assume that hive density within foraging distance is higher than in areas where there are fewer honey bees.
Therefore, by sampling wild bee numbers and species across a range of different sites, as well as counting honey bee numbers, it was possible to determine whether the presence of honey bees influenced the presence, number and population make up of other bees.
Similarly, by comparing the 2020 data with the 2013 survey it was possible to determine the influence of the city-wide 10-fold increase in honey bee numbers.
Competition between bee species – at least in this case – is exploitative.
One bee species exploits a resource that is needed by another bee species. The most obvious things they compete over are the floral resources – pollen and nectar – produced by plants in the area. It’s possible to measure pollen abundance and nectar volume (and sugar concentration, though this should not change in response to bee numbers) and, in this study, pollen was quantified to see if areas with high numbers of honey bees had less pollen.
Study design
I’m not an ecologist so am unqualified to properly judge the study but – to my unqualified eye – it looks pretty reasonable. The paper is freely available so judge for yourself {{3}}. Sampling was conducted at 15 well-spaced sites across Montréal, in forage-rich locations such as community gardens, cemeteries and nature parks. High resolution satellite mapping was used to quantify herbaceous cover and impervious surfaces (concrete, buildings). Bees were collected using pan traps using a standardised sampling procedure for the locations of the traps, their separation, the duration of trapping and the types of day on which trapping was conducted.

Some of Montréal’s impervious surfaces
For example, you cannot meaningfully compare 3 hours of trapping on a wet April afternoon with 6 hours on a gorgeous late summer day. Good foraging days were chosen in June, July (twice), August and September.
In addition to pan traps, aerial trapping (imagine enthusiastic PhD students prancing around swishing butterfly nets) was also conducted in parallel, with samples from each site/date pooled for counting and subsequent identification.
Finally, the same sampling sites were used as were chosen in the 2013 survey (though I think there were a couple of additional sites used as well) to allow relevant comparisons before and after the influx of honey bees.
A few definitions
Honey bees … you know what these are 😉 .
All other bee species were considered ‘wild bees’ i.e. unmanaged, though they acknowledge some Bombus species are managed for pollination services, but did/could not distinguish these from free-living Bombus.
Within these wild bees the authors identified ‘native’ and ‘exotic’ bees; the latter (~12% of the total) being introduced through the activities of man.
The wild bees identified were also separated into two groups – large and small – based upon the inter-tegula span (ITS). This is the distance between the tegulae at the wing bases, and is a very good indicator of body mass and wing musculature which, in turn, is a predictor of foraging range. Bees with a low ITS {{4}} are small, light and only forage over short distances .
Bee communities (i.e. X% of species A, Y% of species B, Z% of species C, remembering the community might contain several dozen species) were characterised using a number of statistical methods that I’m also not qualified to judge properly (though I’ve published several papers using some of the methods cited … 😉 ). Go on, ’fill your boots’ … check out the paper and decide whether Shannon-Wiener or Simpson’s diversity indices are the right ones to use. These methods are fairly standard and have been applied to the analysis of bee communities in previous studies, so let’s assume they’re OK.
Pollen analysis of white clover (Trifolium repens) was also conducted. Not all bees use this as a pollen resource, but many bees do. Pollen was ethanol extracted, stained and counted under a microscope (imagine unenthusiastic PhD students going cross-eyed with boredom … and cursing their supervisor 😉 ).
Wild bee richness and honey bee abundance
Richness is a measure of the number of species and hence diversity of the wild bee population. The hypothesis was that richness would reduce as honey bee numbers increased if there was competition between the bees for limiting resources.
And that’s exactly what was seen.
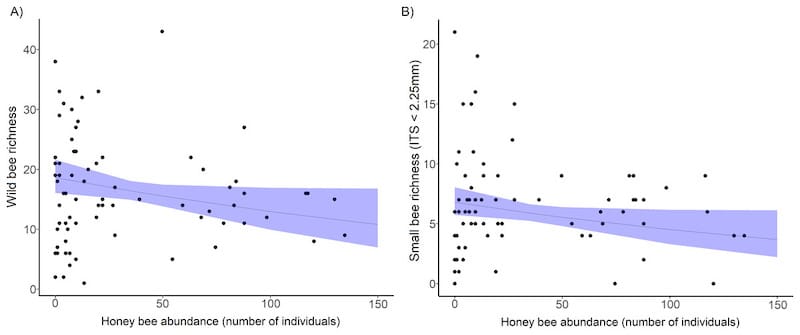
Honey bee abundance and wild bee richness.
These graphs plot honey bee numbers (horizontal) against a measure of species richness (vertical), with each dot being a different sample site/sampling date. The overlaid solid line and shaded blue region represents a best fit and 95% confidence limit respectively.
Since the line slopes down from left to right (a negative slope) it indicates that increased abundance of honey bees results in reduced species richness in the wild bee population across Montréal (left hand graph). Large bees and Bombus (bumble bees, which are very large bees) were unaffected by honey bee abundance (not shown), but small wild bees (right hand graph) decreased significantly.
The wild bee community make up – the range of species and the number of each – is slightly more difficult to explain. Essentially sites with high numbers of honey bees were more similar to each other in their wild bee communities. Sites with low or medium levels of honey bees were more diverse. This suggests that only some wild bees can compete in the face of high honey bee abundance.
The impact of beekeeping on wild bee communities
Unsurprisingly, in light of the results presented above, the ten-fold increase in honey bee hive numbers in Montréal between 2013 and 2020 also negatively impacted wild bee richness.
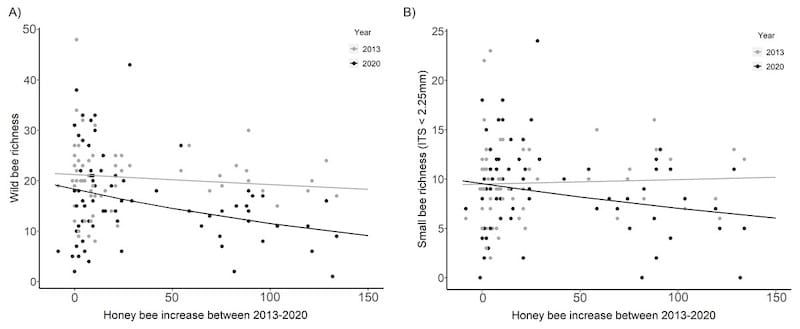
Honey bee increases from 2013 to 202 and wild bee richness
These graphs plot the difference in honey bee numbers at each sampled site between 2013 and 2020 (horizontal axis) versus wild bee richness. The solid black line represents the best fit of the scattered data points having taken into account other variables such as sampling period, floral richness, floral density and the amount of impervious surfaces and herbaceous forage.
Again, the downwards (negative) slope of the line as honey bee abundance increases indicates that wild bee community richness decreases if there are more honey bees about. As before, this was not seen in large wild bees or Bombus, but was significant in small wild bees.
If there are increases of generalist bees – such as honey bees – in the environment, the expectation would be that forage plants, like white clover, would be depleted of pollen and nectar … this was the next thing that was tested.
More honey bees = less pollen 🙁
White clover was widely distributed across the sample sites. It is also a flower that a lot of different bees can access for ‘resources’ (pollen and nectar) … no need for a really long tongue, or strong jaws to cut through the sides of the florets.
Easy pickings for lots of different bees.
Unless there are abundant numbers of honey bees in the environment.
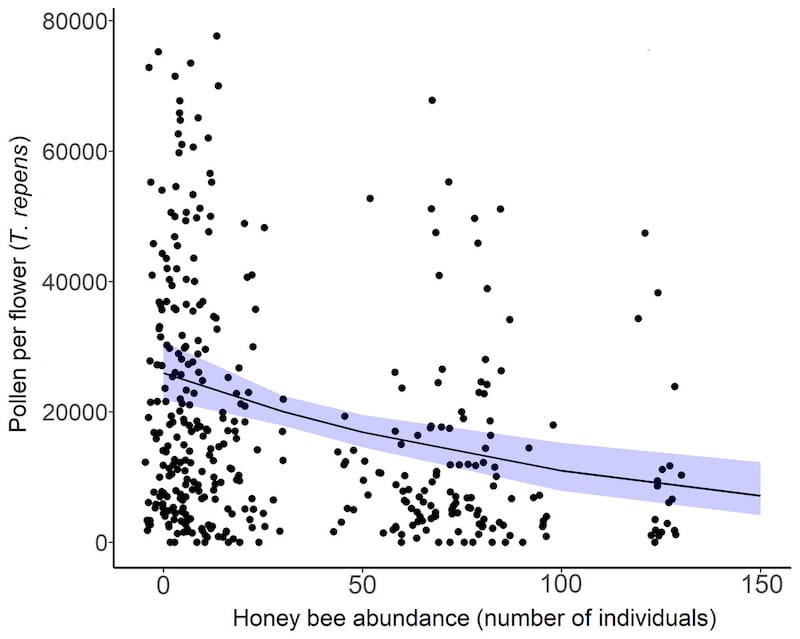
Pollen availability is reduced where honey bees are abundant
The residual pollen on white clover significantly decreased with increasing abundance of honey bees. With less than 20 honey bees detected at sampling sites, each clover flower contained ~24,000 pollen grains. With numbers over 20 honey bees the number dropped to ~14,500.
This decrease was unrelated to other variables tested e.g. the numbers of Bombus at each sampling site.
The assumption here is that the increased numbers of honey bees exploit the available pollen to the detriment of other bees that would otherwise forage on clover.
Is it all bad news?
Unfortunately, yes.
I think that this is one of the better studies of honey bee competition with wild bee populations that I’ve read {{5}}.
It’s worth noting some of the limitations of the study.
There was no sampling early in the season. The size of honey bee colonies in April/May probably makes them fearsome competitors when compared with solitary queens emerging after a winter’s hibernation. It’s likely that omission of early season samples underestimates the negative impact of honey bees on wild bee populations.
Although the only variable measured that influenced wild bee richness was honey bee abundance, perhaps the former declined because of changes in an unmeasured variable. For example, perhaps the floral diversity/community dramatically changed between 2013 and 2020. This data wasn’t collected in 2013 (but was in 2016) but it seems unlikely that it would be dramatically different.
Botanic gardens and urban planting usually contain large amounts of exotic flowers i.e. non-native. Since native wild bees have co-evolved with native flowers, this exotic planting is usually considered to benefit exotic bees more.
Of the 120 bee species identified, 15 were exotic. However, the 13 species missing from sites where honey bees were most abundant were all native bees.
The introduction of large numbers of ‘exotic’ honey bees was particularly detrimental to native wild bee populations rather than other exotic bees. Small native bees (~60% of all species) were the most adversely affected. This is likely due to their very limited foraging range (100’s of metres, rather than kilometres).
’Safe’ colony densities
In the conclusion of the paper the authors briefly discuss the honey bee ‘carrying capacity’ of an environment i.e. the number of colonies that can be introduced without detrimentally affecting native bee populations.
This carrying capacity will vary according to the floral resources available and – although not discussed – will not be constant throughout the season.
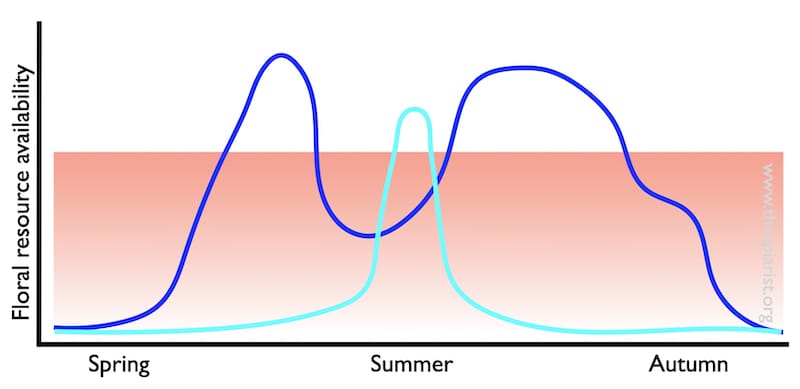
Honey bees decrease floral resources available (red shaded area)
Total pollen/nectar availability (blue line) varies during the season {{6}}. Increasing numbers of honey bees in an environment (red shaded area) effectively reduce what is available.
But this is a gross oversimplification … it assumes that all floral resources are equivalent. Generalists can exploit all these resources.
Some bees are specialists; emerging, maturing, mating, laying and dying during the flowering of a single species or genus of plants (cyan line). If honey bees can use the same resource, particularly if it flowers when there is a shortage of other forage, it could severely limit what is available for the specialist native bee.
MacInnes et al., cite two studies which suggest that 3 or 3.5 hives per km2 is the precautionary recommended colony density that reduces negative interspecies interactions (Steffan-Dewenter and Tscharntke, 2000; Torné-Noguera et al., 2016).
I’ve read these two papers and neither are studies of urban bee populations – one is on the thyme- and rosemary-rich scrubland in the Garraf Natural Park (Barcelona) {{7}}, the other on the calcareous grasslands around Göttingen in Germany. Neither convinced me that the suggested 3-3.5 hives/km2 were based upon evidence that necessarily made them ‘transferrable’ to other environments.
But let’s assume that they are …
Environmental colony densities
The 2918 colonies in Montréal were spread unevenly around 430 km2 i.e. a colony density approaching 7 hives/km2. Remember, there may have been undocumented hives that would increase this number.
I’m unaware of meaningful available equivalent data on hive densities in the UK.
The National Bee Unit (NBU) keep a record of apiary and hive numbers of registered beekeepers (assuming records are up-to-date) but – irritatingly – only publish the apiary numbers. When you register an apiary you can see the number but not location of other apiaries within 10 km.
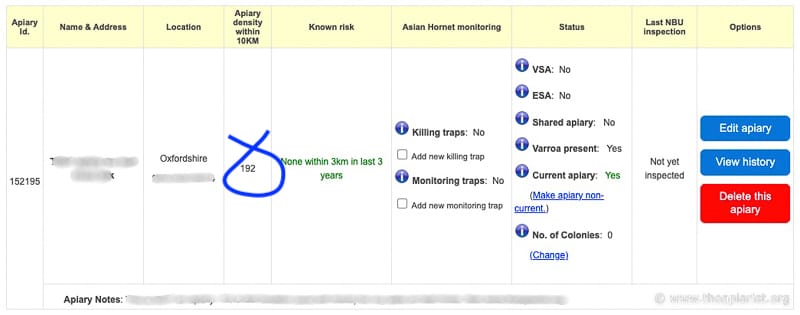
Beebase shows the ‘density’ of apiaries within 10 km
I’ve had apiaries where the NBU “<10km apiary number” is as low as 1 (remote west coast) or as high as 275 (Midlands). My current apiaries on the east coast have ~60 apiaries within 10 km.
A circle of radius 10 km covers an area of 314 km2 . Assuming you know the apiary numbers {{8}}, how many hives would there have to be in each apiary to give a density of 3 or 3.5/km2?
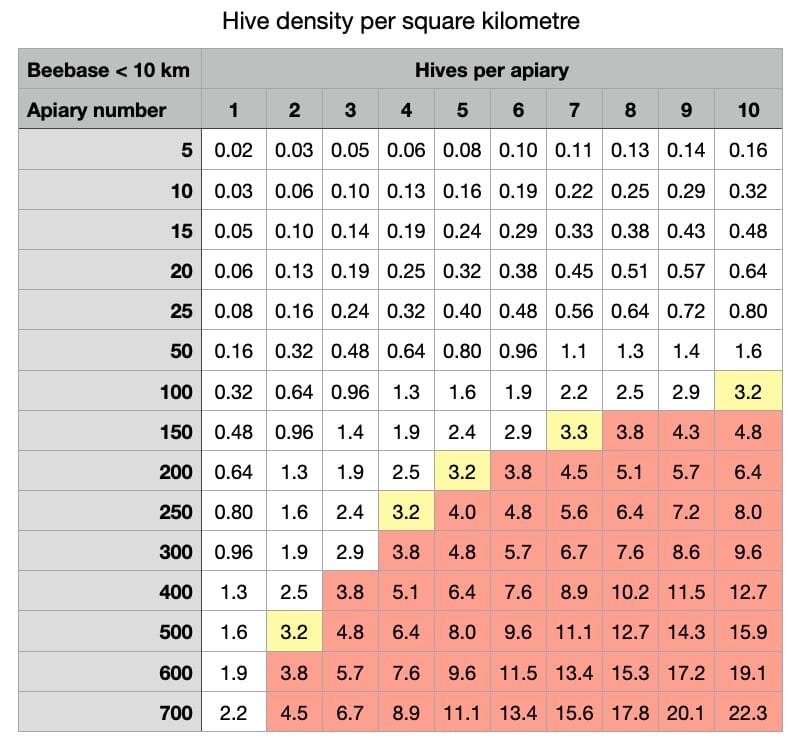
Apiary number and hive density table
Don’t trust my maths (!) but I think the figures above are correct.
My Midlands apiary, with 275 other apiaries within 10 km would have been in an area with over 3.5 hives/km2 if the other apiaries contained an average of ~4 hives each. Based upon my wanderings around the Warwickshire fields I’ve usually estimated that rural apiaries actually average ~5 hives each.
Check your NBU Beebase-registered apiaries. How many other apiaries are there within 10 km? Do your bees forage in an environment with hive numbers above or below 3.5/km2 ?
How about urban apiary and hive densities?
This is getting silly …
I did a quick check of apiary numbers in London, Cardiff, Glasgow and Edinburgh. Central locations in Cardiff, Glasgow and Edinburgh had 196, 144 and 210 apiaries respectively within 10 km.
Perhaps wrongly I’ve always assumed that hive numbers per apiary are less in urban than in rural locations.
People are busy working, gardens are small, balconies are cramped and who wants to carry 36 supers onto a flat roof?
If you assume there are 3 hives per apiary in these cities then the hive densities are well below the suggested 3.5/km2 threshold.
But London is a different matter altogether.
I checked both outer and central London … both locations I was familiar with. Outer London had 441 apiaries within 10 km and the central location I chose had an eye-watering 719 🙁 .
Unless these apiaries contain only one or two hives each it’s likely that the 3.5/km2 hive threshold is exceeded.
If you are an urban beekeeper check the apiary numbers where your hives are registered. There will be considerable geographic variation – even over quite short distances – depending what’s ‘in range’.
Conclusions
As I’ve said before, beekeepers have a responsibility to their bees and to the environment in which we keep bees.
If we behave in a way that is detrimental to the environment it will, eventually, be detrimental to our bees. But that selfish justification shouldn’t be needed … there should be no satisfaction in swamping an area with hives if it results in the loss of native bees and other pollinators.
It seems as though this summer has been poor in terms of honey yields … not everywhere of course, but in many locations. If our bees are struggling just imagine the impact the presence of our colonies are having on the native pollinators that they share the environment with.
And remember, the environment is being depleted, denuded and degraded; hedges are being grubbed out, field margins ploughed up, flower meadows converted to silage production, pesticides are widely used and native habitats are concreted over as urban areas expand.
It’s already tough out there for the hundreds of other bee species which our bees now compete with.
When it comes to enhancing pollinator numbers and diversity, honey bees probably aren’t the solution … but they might well be part of the problem.
Notes
For those of you who have coastal or lakeside apiaries remember that the NBU ’10 km radius’ probably isn’t smart enough to take the water into account. One of my east coast apiaries has about 130 km2 of North Sea within 10 km, almost all of which appears to be devoid of bees of any sort 😉 .
I’m aware of the deficiencies in my apiary/hive density calculations and will return to this at some point in the future. If you assume honey bees forage 2 km from the apiary, a large apiary (e.g. a shared or association apiary) containing 25 hives will result in a local hive density of 3.5/km2.
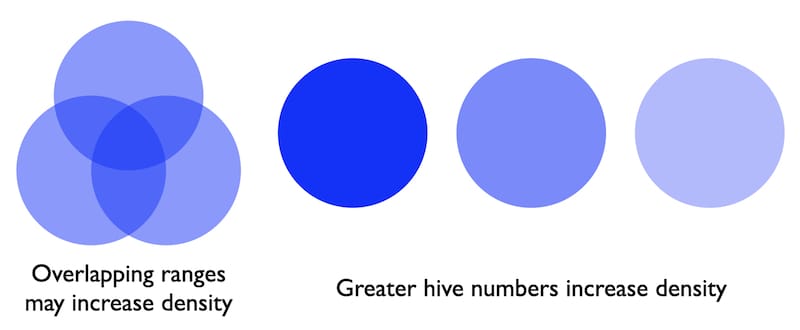
High hive densities from overlapping apiary ranges … or just big apiaries
But, if apiary ranges overlap and plant resources are unevenly distributed (which they are) then much lower hive numbers could result in higher local hive densities.
References
MacInnis, G., Normandin, E., and Ziter, C.D. (2023) Decline in wild bee species richness associated with honey bee (Apis mellifera L.) abundance in an urban ecosystem. PeerJ 11: e14699 https://peerj.com/articles/14699. Accessed June 6, 2023.
Normandin, É., Vereecken, N.J., Buddle, C.M., and Fournier, V. (2017) Taxonomic and functional trait diversity of wild bees in different urban settings. PeerJ 5: e3051 https://peerj.com/articles/3051. Accessed August 17, 2023.
Smith, T.J., and Saunders, M.E. (2016) Honey bees: the queens of mass media, despite minority rule among insect pollinators. Insect Conservation and Diversity 9: 384–390 https://onlinelibrary.wiley.com/doi/abs/10.1111/icad.12178. Accessed August 16, 2023.
Steffan-Dewenter, I., and Tscharntke, T. (2000) Resource overlap and possible competition between honey bees and wild bees in central Europe. Oecologia 122: 288–296 https://doi.org/10.1007/s004420050034. Accessed August 16, 2023.
Torné-Noguera, A., Rodrigo, A., Osorio, S., and Bosch, J. (2016) Collateral effects of beekeeping: Impacts on pollen-nectar resources and wild bee communities. Basic and Applied Ecology 17: 199–209 https://www.sciencedirect.com/science/article/pii/S1439179115001504. Accessed August 16, 2023.
{{1}}: Hence Montréal … think of the French.
{{2}}: These are known hives, there may be unknowns as well.
{{3}}: Particularly if you are an ecologist.
{{4}}: In this study 2.25 mm, but take care when reading other studies as not all standardise on this.
{{5}}: Or perhaps it’s just one of the more understandable ones … ecology is difficult, there are a lot of variables and – over multiple seasons – a lot of stuff changes.
{{6}}: Note that the data is made up on this graph.
{{7}}: A lovely environment.
{{8}}: And that they are accurate … they’re not. They are an underestimate. Perhaps by 30-40%?
Join the discussion ...