Dancing in the dark
Synopsis : Hive inspections, receiver bees and the complexity and inherent errors of the waggle dance. Lots to think about as the nectar flow (finally) starts.
Introduction
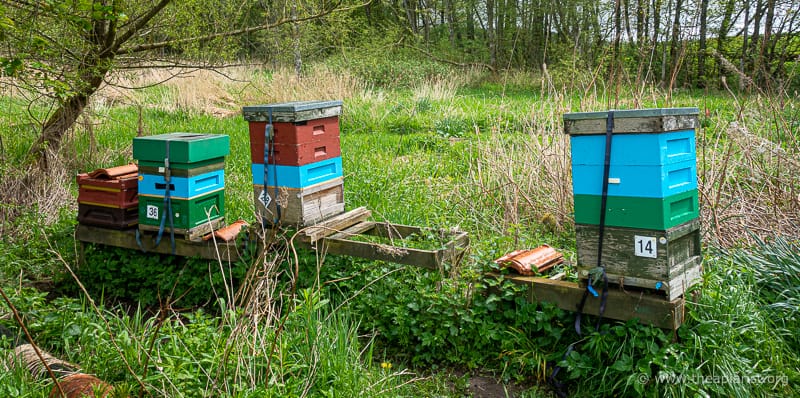
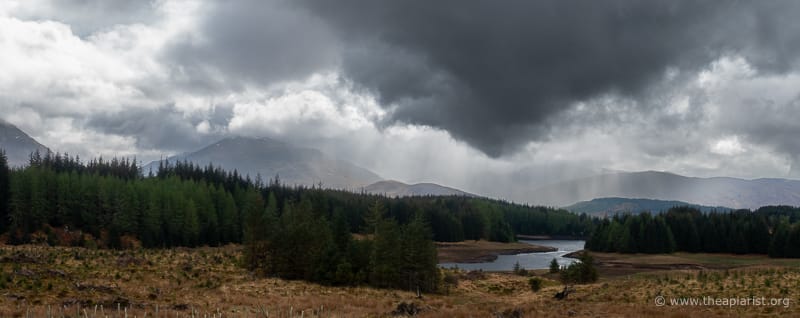
I spent a lovely day on Tuesday checking my colonies in Fife. Finally – better late than never – we have a nectar flow and the bees were making the most of the good weather. The air was thick with returning foragers and the hive entrances were very busy.
Busy boxes and lots of brood
Although there was a bit of nectar in the very strongest colonies last week, the majority had needed feeding … not entirely surprising considering the temperatures has averaged less than 10°C since mid-April. With only about three days exceeding 15°C (maximum) since the OSR started flowering it’s no wonder that supers were empty and colonies were dangerously light.
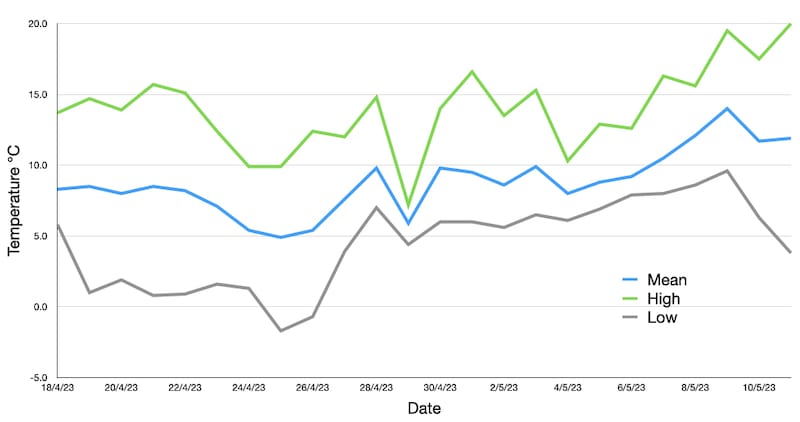
Fife temperatures – mid-April to early May 2023
It’s great doing colony inspections on warm days when there’s a good nectar flow. The bees are so preoccupied with piling in the nectar and pollen that they barely notice the beekeeper rummaging about looking for queen cells.
My own colonies are some way off swarming yet. There were a handful of play cups, but not a sign of a queen cell. This isn’t altogether surprising. The absence of nectar has held the colonies back, meaning they are less strong than they should be.
This also means that it’s a bit easier to see what’s happening inside the hive and there were a few things I noticed that were worth commenting upon.
Stores, pollen and the brood nest
All my colonies are arranged ‘warm way’, with the top bar of the frame parallel to the entrance of the hive. I stand behind the hive for inspections. I’ve always done it like this and it suits my beekeeping, and my back.
My boxes are Nationals, of a variety of types. Most take 10 or 11 frames together with a dummy board to avoid a brace-comb-attracting gap at the front or back of the box.
The dummy board is at the back of the box and is the first thing to be removed during an inspection.
Typically, the frame – or frames – near the back of the box (which, since I stand behind the box, is the closest frame to me after removing the dummy board) will contain stores, but my colonies are all a bit light and these frames have largely been stripped bare.
All the colonies are supered and these contain varying amounts of nectar, broadly directly related to colony strength. There’s no danger of these colonies starving.
Finally … filling supers
After the stores (or the empty frames in this instance) is a frame packed with pollen, which is adjacent to the edge of the brood nest. The remainder of the frames contain brood – eggs, larvae or capped pupae – which normally extends to the front of the box, though the frame on the ‘far’ side of the brood nest is sometimes also packed with pollen.
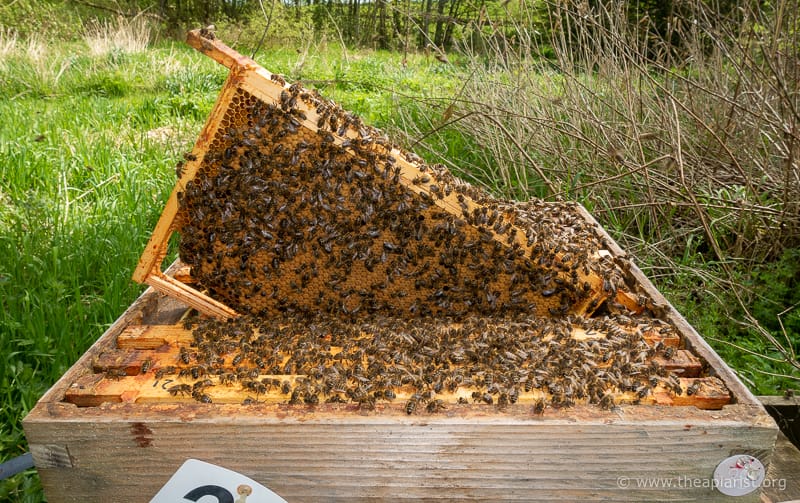
Nectar
As I worked my way through the frames, from back to front, there were increasing amounts of nectar in the brood frames. This is the first time I’ve been so aware of this distribution. The front 3-4 frames were heavily backfilled with nectar, meaning that any cells not occupied with brood contained fresh, runny nectar.
If I held the frame horizontal, some of this dripped out onto the open hive (or my boots if I’d inadvertently stepped back).
There was ample space in the honey supers. Indeed, most were disappointingly unoccupied by tens of kilograms of nectar 🙁 .
My understanding of nectar processing is somewhat limited. Returning foragers are supposed to transfer the nectar by trophallaxis to receiver bees. The latter then transfer the nectar further within the hive, eventually depositing it in the comb above the brood nest (the supers) where further processing takes place to reduce the water content before capping.
Was this backfilling of nectar within the brood nest being done by the returning foragers unable to find a receiver to unload their crop contents? Or was it being done by receiver bees? Were there insufficient receiver bees – due to a complete or partial brood break triggered by the lousy weather and the dearth of nectar – to handle the nectar flow once it did, finally, start to actually flow?
I’ve opened dozens of hives during a good nectar flow over the years and not seen the brood nest so obviously packed with freshly collected nectar. I need to read up a bit more on the rate-limiting events that happen inside the hive during nectar processing to understand this a bit better.
Groovin’ on the dance floor
The other striking thing about the front 2-3 frames were the very large number of returning foragers that were waggle dancing. There were far more on these frames than on those further back in the hive. I’ve described the waggle dance in quite a bit of detail previously and – in the interest of brevity {{1}} direct you back to that rather than regurgitating it all again here.
In previous routine hive inspections I usually find dancing foragers advertising the direction and distance of a good nectar or pollen source. Are they evenly distributed through the brood nest? I can’t say I’ve ever really noticed, but neither have I noticed a distinct bias to the front frames in the hive.
I attempted to video one or two frames but it was all a bit hopeless as I had no tripod and nowhere to hang the frame. I’ll briefly embarrass myself with this shaky and wholly unsatisfactory movie which shows many busily dancing foragers on the frame.
Before I waffle on a bit more about waggle dancing I ought to also mention a previous post on social distancing in honey bees. This was a rather contrived pandemic-related title that looked at the location(s) – the dance floor – within the hive where the waggle dance was performed. The authors reported that the Varroa infestation level influenced dance floor location, with it being shifted to peripheral locations in heavily infested colonies. The ‘justification’ was to reduce mixing with nurse bees, largely confined to the centre of the brood nest.
I don’t think this is relevant in the hives I checked on Tuesday – all have a very low level of Varroa.
Not dancing, but reading
After getting back from the apiary I did a little reading to try and discover a bit more on the location of the dance floor. I didn’t get far as I rapidly got distracted and disappeared down a rabbit hole of waggle dance-related literature that has entertained me for the last few days.
Before I discuss three particular points I should add that I have yet to read Jurgen Tautz’s new book Communication between honeybees. I bought a copy a few months ago but have yet to find time to sit down and go through it … and in the absence of an index (there isn’t one) I couldn’t ‘cut to the chase’ and check if he discusses dance floors.
Reading the dance information
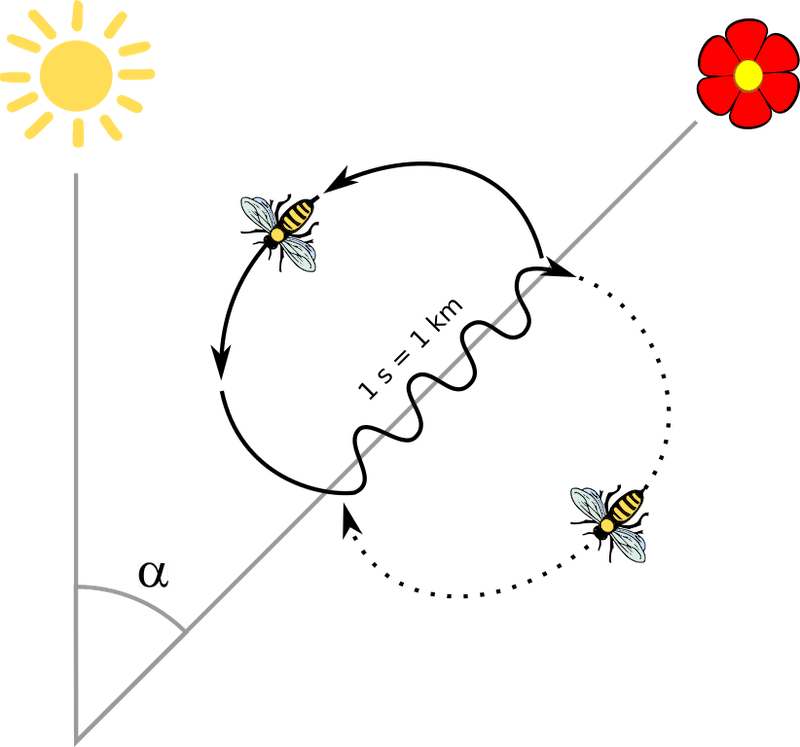
You’ll remember – and if you don’t, I’ll remind you – that the figure of eight (or, perhaps more correctly, theta-shaped) waggle dance essentially encodes three pieces of information about a nectar {{2}} source:
- direction
- distance
- quality
The direction, relative to the sun, is indicated by the angle of the linear waggle phase of the dance away from vertical. The distance is communicated by the duration of the linear waggle phase, using the rough approximation of 1 second = 1 kilometre {{3}}. Finally, the quality is reflected in the enthusiasm the dancing bee performs the dance with, both in terms of the number of waggles and the number of repeats.
The waggle dance
Have you ever tried decoding the waggle dance being performed by your own bees?
Have a go sometime.
Rescue a protractor from your school pencil case and a stopwatch (far easier than using a smartphone). Time the waggle run and measure the bearing. Then do another, and another, and another.
If a bee performs multiple repeats of the dance, the first and the last are usually rather inaccurate, and you really need to average at least four repeats having ‘discarded’ the first and last runs.
It’s not easy … 😉 .
With a large scale map, sufficient patience and a limited number of nectar sources yielding at the same time, you can usually identify where the bees are foraging.
Automating waggle dance analysis
It will come as no surprise that some enterprising scientists have found ways to automate the analysis of the waggle dance (Wario et al., 2017).
A single frame observation hive is illuminated on both sides using infra red LED’s (remember, the dance usually occurs in the dark environment of the hive {{4}} ). Each side of the frame is then imaged using two cheap webcams (butchered to remove the IR filter on the sensor) and the resulting livestream, or recorded video, is then processed using software.
I’m not going to pretend to understand the maths, the ’filtering with convolutional neural network’, the application of ’Fourier slice theorem’ or the use of ‘threshold Euclidean distances’ … I’m just grateful someone does 😉 .
For our purposes what matters are the results.
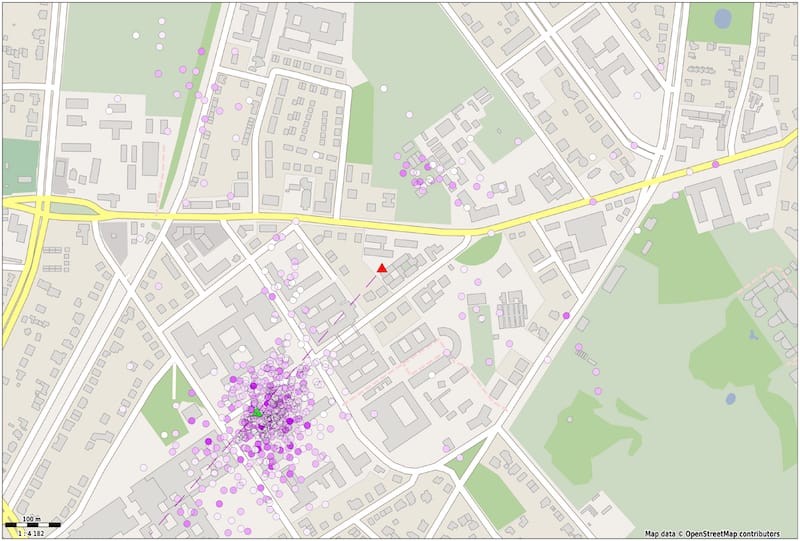
Map of automated dance analysis
The red and green triangles represent the hive and the feeder locations respectively, with the dashed line between them indicating the average direction of all the dances. The coloured spots indicate the mapped locations from the automated waggle dance analysis, with white spots representing daces with just four waggle runs and increasing shades of purple to a maximum of 17 waggle runs per dance.
All of those ‘convoluted Euclidean Fourier slices’ (or whatever) detected 90% of the dances filmed with an average directional error of ~3°, which is significantly less than you’d manage with your protractor and stopwatch 😉 .
For geeks enthusiastic readers the software is free to download together with a complete hardware description if you’d like to try this at home.
Have a look at that map again … although the average direction is accurate, the scatter is considerable.
Dance error – adaptive or inherent constraint?
The ‘nectar’ source in the study above is a single point location, not 400 acres of oil seed rape. There’s only one correct angle from the hive to the feeder. If you accept that there’s a low amount of error in the automated dance interpretation, there’s still significant variation in the vector information (the angle relative to the sun) provided by the dancing bees.
This error has been known about since the 1950’s. Interestingly, “the degree of angular vector variation or ‘error’ in the dance decreases with increasing distance to a resource” (Preece and Beekman 2014). A consequence of this is that the spread over which the bees are directed remains about the same with increasing distance.
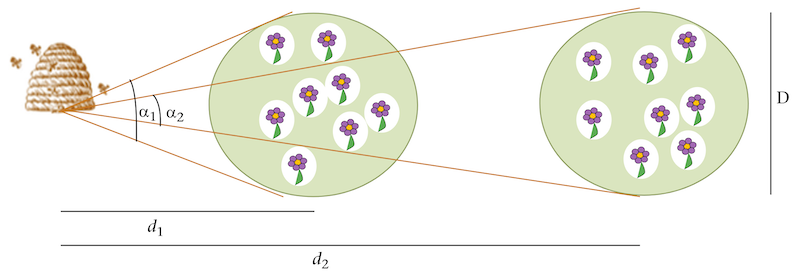
Dance error decreases as distance to target increases
Most nectar sources are not point sources … instead, they’re a large field, or a hedgerow, or a clump of trees. It therefore might make sense for the dancing bees to direct the dance followers to ‘somewhere over there’ without being too precise.
This lead to the ‘tuned error’ hypothesis that suggests that the error in the dance is adaptive because spreading the dance recruits over a wider area has an evolutionary advantage.
Conversely, there’s an alternative explanation. This states that the dance error is due to biophysical limitations and the dance environment, and that it cannot be modified by the bees i.e. it is an inherent constraint.
The ‘tuned error’ hypothesis is attractive because almost everything biological can be explained in evolutionary terms … but that doesn’t make is correct.
Dancing in the dark
Supportive evidence for the ‘tuned error’ hypothesis came from studies of scout bees dancing to indicate a potential nest site – which is a point source. These dances have less inherent error … but they’re also conducted in a completely different environment; in daylight (with a view of the sun) and, usually, on the surface of a bivouacked swarm.
’Usually’, because the scientists typically provide a flat mesh for the scout bees to dance on which makes recording and analysing the dance a two-dimensional rather than a three-dimensional problem.
It turns out that the substrate and environment has a significant influence on the dance. The use of a mesh substrate decreases dance error as does a view of the sun. What’s more, the substrate also influences the outcome of the dance; bees that dance on empty comb recruit three times the number of followers as those that dance on capped brood or stores.
The accuracy of the dance is also inversely related to the quality of the nectar source, which influences the ‘enthusiasm’ exhibited in the dance.
Better quality nectar sources lead to a faster return phase in the waggle dance and an increased number of waggle phases. Not all circuits are equal, and – as mentioned above – the first and the last are error prone and usually discarded during automated analysis.
They are also effectively ignored by the followers … these bees average multiple repeats of the dance. Therefore deliberately introducing errors into the dance would be unnecessary and redundant.
Preece and Beekman (2014) do a very nice job of reviewing the tuned error and inherent constraint literature. They conclude that the error in the dance is because the bees cannot dance any more accurately. It’s a physiological constraint, not an adaptive feature of the the dance.
Rhum lines and maps
Dance followers are directed to fly at a particular angle for an approximate distance {{5}} which we’ll call the linear phase of the journey. If that doesn’t take them to source they search the area to which they’ve been directed to find the nectar source (the search phase).
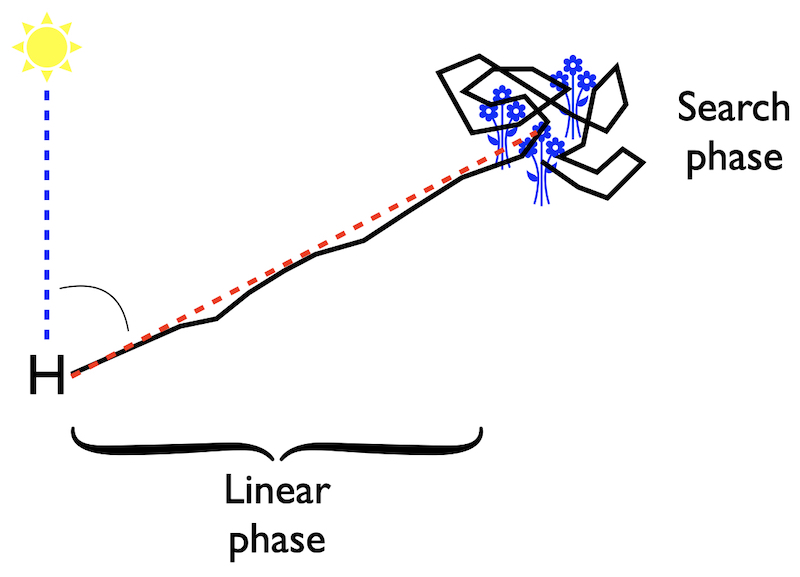
Linear phase and search phases of the waggle dance
There are additional clues to help them, including olfactory, but I’ll deal with those another time.
Effectively the linear phase of the journey is a rhum line – this is a nautical term meaning the course followed by a ship sailing in a fixed direction. Rhum lines are origin specific if the ship is to get to it’s correct destination.
If I wanted to get from Abelo in York to Thorne’s in Market Rasen (in a straight line) I’d fly 50 miles at 140°. However if, for whatever reason, I followed the same directions but started in Manchester I’d end up somewhere near Derby.
There’s nothing wrong with Derby, but it’s not my intended destination.
How would I get from Derby to Market Rasen? I’d look at a map or, having a mental map of central England, I’d set off in the right direction and then search for Thorne’s as I approached Market Rasen.
OK, enough amateur geography.
The purpose of that little trip around central England was to introduce a very recent study of the honey bee waggle dance (Wang et al., 2023). This work suggests that the dance followers get two messages from the dance; 1) polar flying instructions (bearing and range, just as suggested by von Frisch), and 2) a location vector that allows the bees to approach the source from anywhere in their familiar territory.
Displaced followers
The Wang et al., (2023) study is ‘data rich’ and much of the data is rather complicated. However, the basic experiment is very simple and the overall results are reasonably straightforward.
Dance followers were trapped leaving the hive, tagged with a transponder so that they could be followed using harmonic radar, and then transported away from the hive and released. The resulting flight path followed by the bees was tracked, plotted and computationally analysed.
The premise is simple. If the waggle dance only provides bearing and range information the expectation would be that the tagged followers would set off at the correct bearing (from the displaced starting location), fly the set distance and then search about for a nectar source. Some might find the correct nectar source (by chance), but most would not.
In contrast, if there was some additional information encoded in the dance and if the bees have a mental map of the foraging area around the hive it might be expected that many more of the followers would end up at the correct nectar source.
And that’s what happens.
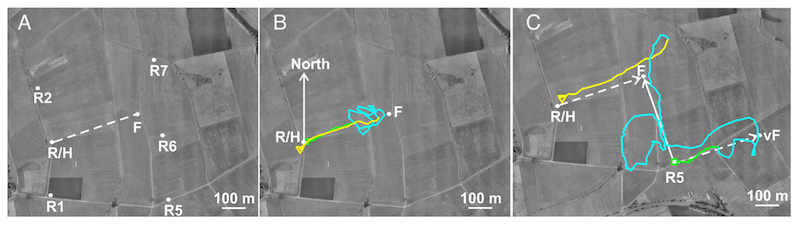
There’s more information in the waggle dance (click for descriptive legend)
Followers were displaced hundreds of metres from the hive entrance. They initially set off at the correct bearing from the release site, but subsequently veer off and start a search pattern that resulted in most of them eventually finding the nectar source (a feeder). By analysing multiple flights, the authors demonstrate that the followers approached the nectar source from many different directions.
Maps and rhum lines
I’ve neither the space, the IQ or the energy to exhaustively discuss the results of the Wang et al., (2023) study. The results are surprising as they suggest that the 50+ year old conclusions from von Frisch’s Nobel Prize winning waggle dance studies are incomplete.
Rather than simply providing ‘rhum line-like’ instructions they imply that the dance also somehow conveys some mapping information, such as landmarks to be encountered en route. These, coupled with a mental map of the foraging area around the hive, are sufficient to eventually lead the follower to the correct destination.
The form this positional information takes, the way it is encoded in the waggle dance or the mechanism by which the followers decode it and apply it to a mental map they carry remains more than a little obscure. This work is at the interface of behavioural science and neurobiology. Subsequent studies will be a challenge to conduct and even more of a challenge to read.
Just because the results are surprising doesn’t meant that they’re wrong 😉 . The work is published in an excellent journal and is likely to stimulate many further studies of the honey bee waggle dance. Lots to think about as I drove back through the rain to the west coast.
Mainly dry
Honey bees are the only nonhuman animals that communicate navigational information by a symbolic form of information transfer (the waggle dance). This dance is also one of the best understood types of animal communication, and one which we have long thought we could interpret correctly.
Clearly there’s a lot more to learn.
When you next open a hive, look for the dancing bees, look at where and what they’re dancing on, try to interpret the dance … and marvel at both the simplicity and apparent complexity of the message.
References
Preece, K., and Beekman, M. (2014) Honeybee waggle dance error: adaption or constraint? Unravelling the complex dance language of honeybees. Animal Behaviour 94: 19–26 https://www.sciencedirect.com/science/article/pii/S000334721400236X.
Wang, Z., Chen, X., Becker, F., Greggers, U., Walter, S., Werner, M., et al. (2023) Honey bees infer source location from the dances of returning foragers. Proceedings of the National Academy of Sciences 120: e2213068120 https://www.pnas.org/doi/10.1073/pnas.2213068120.
Wario, F., Wild, B., Rojas, R., and Landgraf, T. (2017) Automatic detection and decoding of honey bee waggle dances. PLOS ONE 12: e0188626 https://journals.plos.org/plosone/article?id=10.1371/journal.pone.0188626.
{{1}}: Ha!
{{2}}: Or pollen, or – if being performed by a scout bee – potential nest site.
{{3}}: I’ve simplified this hugely … bear with me.
{{4}}: Though not always. Scout bees dance in the daylight on a bivouacked swarm … I’ll return to this shortly.
{{5}}: I’m going to skip over distance measurement here as it’s another complex story.
Join the discussion ...