Radar love
The average beefarmer in the UK is probably somewhere in their mid-60’s {{1}}. This means that in 1973, when the Dutch rock band Golden Earring had their only notable chart success Radar love, they were about 18.
Bear with me …
As 18 year olds they probably wore denim flares and loud shirts with spearpoint collars. They would go to the local disco to meet similarly-attired members of the opposite sex (whose shorter hair may have been their only distinguishing feature).
They knew when and where to meet … the weekly Saturday night (obviously {{2}} ) disco.
There was no point in turning up at 10 in the morning … the disco was closed 🙁
Similarly, despite their ‘cool threads’, wearing them to the launderette would have resulted in almost certain disappointment … the dance partners they were seeking weren’t likely to be found doing the laundry 🙁
No, the disco was the place to go.
Radar love would have been on the playlist. It reached the top 10 in the charts in many countries.
Hold that thought … we’ll return to Radar love in a few minutes … {{3}}
The birds and the bees
Of course, these young beefarmers didn’t just go to the disco to dance.
Oh no.
They had an ulterior motive 😉
They knew that they had a good chance of meeting a like-minded (and similarly attired) member of the opposite sex who was also ‘looking for love’.
These meetings were effectively ritualised … a particular time and place.
Let’s forget the bell bottoms and hippie shirts now … I only added that detail so that any readers who know an ageing beefarmers can have a little giggle imagining them dressed for the disco 😉
OK, back to the disco … metaphorically.
The disco is not fundamentally dissimilar to the lek used by male grouse {{4}}.
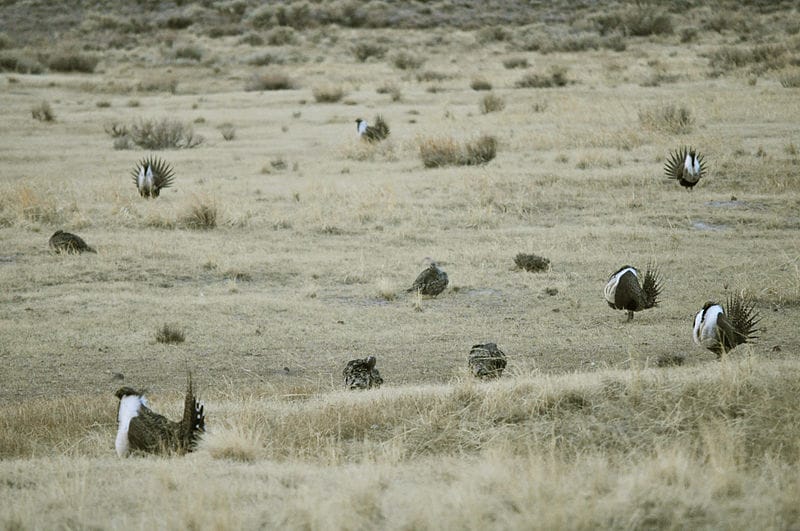
Greater sage-grouse at a lek, with multiple males displaying for the less conspicuous females
A lek is defined as a location where males congregate to compete and mate with females. Importantly, there are no direct benefits – such as food or territory – that the females gain from attending the lek {{5}}.
How do the males know where to congregate?
Grouse tend to live for several years {{6}}. Older grouse know where the lek is because they attended last season. Juveniles probably tag along and learn from their elders despite the fact they are too immature to mate, or lack the social dominance (or plumage {{7}} ) to compete.
As a consequence of this male hierarchy the location of the lek is invariant.
The birds congregate at the same place each year.
One of the features of leks is that males show high levels of fidelity to a single lekking site.
So now we know something about the birds … what about the bees?
Drones congregate in particular – rather ill defined – landscape features called drone congregation areas (DCA’s).
These, like a black grouse lek, are stable from day to day and year to year.
The drones compete (for the queen, though not directly with each other by displaying) and offer the queen no territorial or food benefits … meaning that DCA’s are effectively insect leks {{8}}.
Drone congregation areas
There are studies going back well over 50 years on DCA’s. There are no hard and fast rules that define their location (at least to humans … thankfully virgin queens have no problems finding them). However, you can sometimes hear them; they sound like a small swarm, the noise caused by thousands of drones circling 5-40 metres above the ground in a swirling, traffic cone-shaped, perhaps a 100 metres or more in diameter.
How do drones know where to congregate? There is no male hierarchy {{9}}. An individual drone lives for just a few weeks and perishes before winter.
The location must be somehow ‘hard-coded’ in the environment. Effectively a set of features that – once located – attract the drones back repeatedly until they either mate with a queen, or die trying {{10}}.
Many studies have attempted to identify DCA’s – geographic features on the ground, sheltered from strong winds, a dip in the horizon etc. These have tended to produce rather mixed results.
I don’t think we’re anywhere close to being able to point to an intersection of two hedges and say “Over there … that’s where drones will congregate”.
An alternative approach is to go fishing for DCA’s.
Literally.
Having identified a number of potential DCA’s from landscape analysis, you can dangle a virgin queen from a helium balloon and sample the drone density in each of the areas.
It sounds a lot simpler than it is … there’s a nice account by Aude Sorel in Bee Culture if you’re interested.
By definition, the drone congregation areas are the ones you trap the most drones in.
Right?
Well, possibly not.
Perhaps the very method used to sample the drones attracted them there in the first place?
It’s been known since the 1960’s that high concentrations of queen mandibular pheromone can attract drones to almost any location – in one notable example, even 800 metres out to sea {{11}}.
If you use bait, how can you be certain that the areas you define are ‘real’.
A better way to define a DCA would be to observe individual drones accumulating in a particular area … to watch them leaving the hive, fly the tens or hundreds of metres to the same place they flew to yesterday, and record them ‘strutting their funky stuff’.
Have you ever tried to follow a drone in flight?
They’re strong and fast. They need to be to outcompete other drones when chasing the queen.
It’s almost impossible to track them across the apiary, let alone over the hedge, across two fields and into the lee of a copse.
But scientists can now do exactly that … using a technique called harmonic radar tracking.
The title of this post should now make a bit more sense … it’s the use of radar to find where drones go ‘looking for love’ 😉
Harmonic radar tracking
A harmonic radar system emits a stimulus signal. This signal is picked up by a harmonic tag (the transponder) which uses the low frequency stimulus energy to generate a second harmonic which is then re-radiated back out to a receiving system.
The harmonic signal emitter/receiver is portable … if you’ve got a lorry.
Harmonic radar emitter and detector – with Rothamsted Manor in the background.
Fortunately, the transponder is tiny … small and light enough to be glued to the back of a bee.
Drone with harmonic radar transponder attached.
Harmonic radar has been used to study orientation flights in honey bees {{12}}, to track Asian hornets, and to follow butterfly flight paths {{13}} (amongst other things).
And now it’s been used to map drone congregation areas by tracking the flights of individual drones from the hive.
Harmonic radar is a relatively short range system. You can’t track transponder-tagged insects flying miles away. The effective range is just a few hundred metres for most systems.
However, for drone congregation areas this shouldn’t be a major limitation. Drones generally fly shorter distances to mate than queens (an evolutionary mechanism to avoid inbreeding) and DCA’s have often been found near to apiaries {{14}}.
Tracking drones by harmonic radar
The study, by Woodgate et al., was published a couple of weeks ago in iScience. The full reference is:
Woodgate et al., Harmonic radar tracking reveals that honeybee drones navigate between multiple aerial leks, iScience (2021), https://doi.org/10.1016/j.isci.2021.102499
It’s available under open access (i.e. free, for anyone) and I recommend you read it if you’re interested.
I’m just going to pick out a few highlights.
During two sequential seasons the authors tracked over 600 flights by at least 78 drones. These included 19 first flights (orientation flights) and – for four drones – 6-8 consecutive flights, including their first ever orientation flight.
Orientation flights were typically observed as multiple loops in different directions, centred on the hive from which the drone originated.
Drone orientation flights
The average duration of these orientation flights was ~13 minutes and the drones observed only took one or two before changing their flight pattern (see below) and seeking drone congregation areas.
Worker bees typically take more (~6) orientation flights than drones. Presumably foragers need to ‘map’ the hive location better because they may end up returning to it (and they’ve failed if they don’t) from any location.
As we’ll see in a minute, drones tend to use particular ‘flyways’ which are probably determined by landscape features. Drones also may return to a different hive to the one they set out from.
Identifying drone congregation areas by harmonic radar tracking
Scientists love ‘heat maps’.
These are a graphical way of depicting levels of activity of one kind or another.
If you overlay the flights by every transponder-tagged drone in each of the two years of this study you generate a map (like C and E shown below). In this study they used a ‘white to red’ scale where the paler the colouration, the more drones were detected in that particular point on the map.
You can easily see the hive location (points 1, 2 and 3) as all flights originated there.
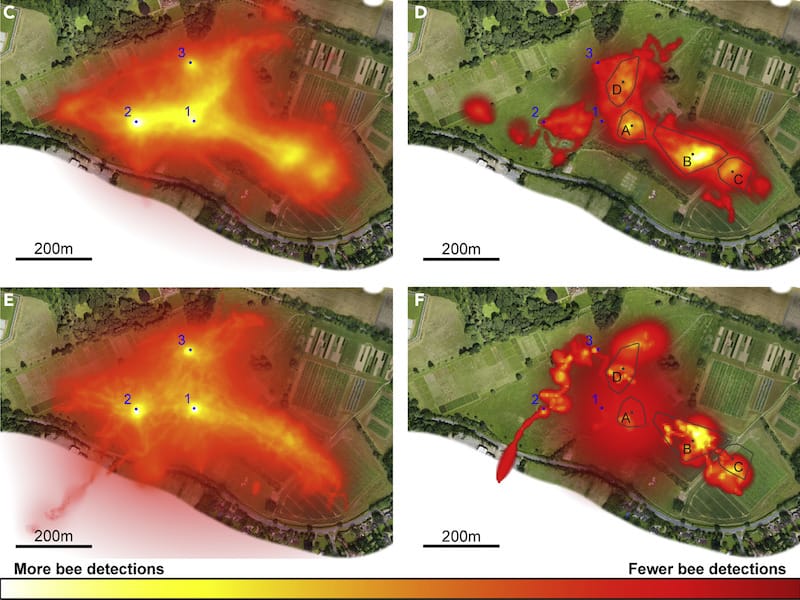
Heat map of the landscape used by drones.
Actually, C and E are a bit confusing because they include the orientation flights which are centred on the hives. If you exclude these you end up with the heat maps D and F on the right.
From these the authors could detect particular areas where the drones tended to concentrate … these are proposed to be the drone congregation areas. There were four within range of the harmonic radar system – A-D above (confusingly labelled on images D and F).
There are a few obvious features of these proposed DCAs:
- They are in approximately (but not exactly) the same position in the two study years.
- The frequency with which they were visited changes. A is visited less frequently in the second year (panel F) than in the first (panel D).
- The most distant DCA (at least that could be mapped in this study) was ~600 metres from the hive.
- Each DCA had a roughly symmetrical ‘core’ of 30-50 metres, significantly smaller than many drone trapping studies suggest..
One thing that was noticeable by comparison of the orientation flights and the proposed DCAs was that they did not overlap.
So how do the drones ‘find’ the DCA if they don’t discover them on an orientation flight?
Flyways, straight and convoluted flights
Heat maps are cumulative data.
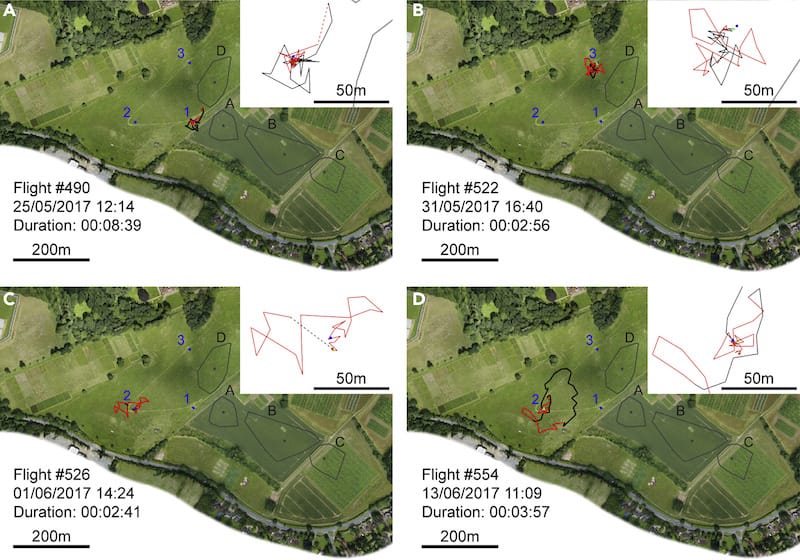
It was also possible to look at the individual flight paths of drones on their way to and from a DCA (in exactly the same way as they mapped orientation flights).
Analysis of these showed that drones adopted two distinct types of flight – an approximately straight, direct flight interspersed with periods of convoluted, looping flight. There are lots of pictures of these in the paper but, rather than showing another published image, here’s my “no expense made spared” diagram of these two patterns of flight.
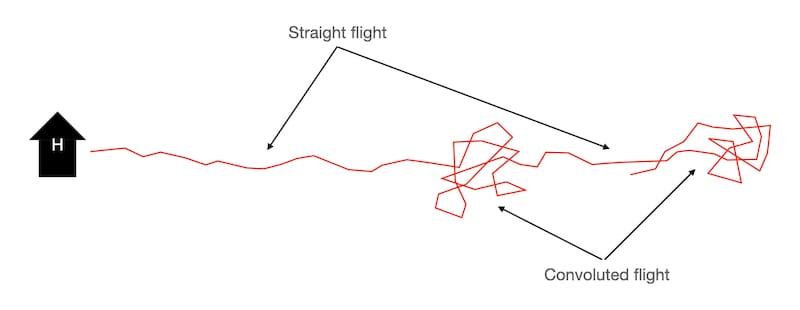
Drone flight paths showing distinct direct and convoluted elements.
The convoluted flight defines the drone congregation areas. In these the drones showed very distinctive behaviour – the further they were from the centre of the DCA the more strongly they accelerated back towards the centre.
Drone flight paths (inevitably) overlapped in DCAs.
However, they also overlapped in the straight line flight. Drones tended to use particular flyways from the hives to, and between, the DCAs.
Scientists have previously identified (or at least suggested the existence of) these flyways that drones use to travel to and from the hive and the DCAs {{15}}.
However, what they had previously not identified was that drones often visit more than one DCA in a single (potential) mating flight.
In 20% of the flights analysed drones visited more than one DCA.
Finally, drones tended to only spend about 2 minutes flying around very fast (at ~5 m/s rather than the sedate ~3 m/s they fly around the hive at {{16}} ) within the proposed DCA.
This suggests that drones might routinely patrol several DCAs in a single flight, moving on unless a queen is present.
Harmonic radar mapping the flights of virgin queens
I’ve often preceded the term ‘drone congregation area’ in the text above with the word ‘proposed’. A DCA has a very specific meaning that describes the places where drones congregate to attempt to mate with a virgin queen.
None of the studies above showed queen mating, or even the presence of a queen.
But, of course, the authors tried that as well.
They transponder-tagged queens (94 in total) and tracked their orientation flights and mating flights (26 in total). The orientation flights were remarkably similar to those of the drones; the average number of these flights was 3 and no queen went on more than 6 orientation flights.
Unfortunately the tracking of queen mating flights was less successful {{17}}.
Queens flew out of range (I’ll return to this shortly), the transponder fell off, or parts of the flight were not picked up by radar. Some of the queens ‘followed’ (or for which tracking was attempted) did get mated, but not apparently in the DCAs identified during the flight tracking of drones.
This type of study clearly needs further work …
Conclusions
Drone congregation areas could be detected using harmonic radar tracking of transponder-tagged drones. Unlike other well-studied lekking areas, males (drones) did not display lek fidelity, but instead visited several in rotation {{18}}.
The DCAs are a consequence of drones exhibiting a convoluted flight pattern in particular locations. The conservation of the flyways – the routes taken by the drones – between DCAs suggest they might contribute to the location of the DCAs.
Understanding what defines these flyways might allow better prediction of DCA locations.
Previous studies have shown that queens tend to fly further to DCAs than drones, presumably to avoid inbreeding. One possibility is that tagged queens in this study might have been more likely to visit the four DCAs identified if they were placed in mating nucs situated further away from this study site.
But, of course, they could have then flown off in a different direction altogether 🙁
Finally, it’s worth noting that a different pattern of queen mating activity had been described for dark, native (Apis mellifera mellifera) and near-native bees. This is apiary vicinity mating (AVM), and is nicely described by Jon Getty on his website.
I now have some native black bees. I’m also experiencing the worst spring of my entire beekeeping career for queen mating. I am increasingly interested in AVM as a mechanism for saving the queen from drowning or freezing to death while attempting to reach a DCA 🙁
{{1}}: 66 years old was the figure quoted in 2015, but it may be less now they have an active apprenticeship scheme.
{{2}}: Actually, Saturday Night Fever was a few years later, in 1977, so I’ve taken a bit of artistic licence there.
{{3}}: As an aside, Radar love isn’t really disco, at least not like the more mainstream floor fillers like Donna Summer or the Bee Gees. However, Radar love has outlived lots of stuff from the 70’s as it is one of the best driving songs of all time (or perhaps best ‘speeding’ songs of all time). For readers who speak Dutch there’s more than you ever wanted to know on radar-love.net.
{{4}}: And certain deer, species of fish, frogs, fiddler crabs and some insects – see here for the taxonomic distribution of lek mating.
{{5}}: The etymology of lek doesn’t appear to go back any further than Darwin’s Descent of Man, published in 1883. ‘As many as forty or fifty, or even more birds congregate at the leks. The lek of the capercailzie (now capercaillie, the largest of the grouse) lasts from the end of March to the..end of May’.
{{6}}: Or should, if they’re not shot.
{{7}}: Careful, we’re drifting back to flares again … before we go, here’s a reminder of those heady days.
{{8}}: They are not unique in this regard … lek mating is known to occur in other Hymenoptera (like paper wasps and some ants), in some Lepidoptera (moths and butterflies) and in certain Diptera, like fruit flies.
{{9}}: As I described a fortnight ago, they don’t have a father, so can’t learn from him …
{{10}}: And, those that do mate with a queen have a similar fate.
{{12}}: Capaldi, E. A. et al. Ontogeny of orientation flight in the honeybee revealed by harmonic radar. Nature 403, 537–540 (2000).
{{13}}: Cant, E. T., Smith, A. D., Reynolds, D. R. & Osborne, J. L. Tracking butterfly flight paths across the landscape with harmonic radar. Proc. of the Royal Society: Biological Sciences 272, 785–790 (2005).
{{14}}: But how were they found? Often with pheromone/virgin queen lures. It could be argued that this is a bit of a self-fulfilling observation. Waft some queen mandibular pheromone about in the vicinity of an apiary stuffed with randy drones and you’re going to quickly be in the middle of a DCA!
{{15}}: Including in some very early lower resolution, radar-based studies.
{{16}}: And you couldn’t follow them by eye then, so there’s no hope of following them in a DCA!
{{17}}: Just go back and look at the numbers in the paragraph above again … 94 queens tagged, 26 tracked (how many queens have you seen outside the hive?) … that’s an enormous amount of fieldwork. Respect!
{{18}}: There is circumstantial evidence that lek-like aerial swarms of some insects – think of the plumes of midges you sometimes see over particular bushes or treetops – may have a conserved size and shape because individuals are constantly joining/leaving, but there is no experimental data to support this.
Join the discussion ...