Natural mite drop
The Varroa tray underneath an open mesh floor (OMF) provides a non-invasive insight into colony state and activity and, to a lesser extent, health.
State and activity include things like whether the colony is expanding or contracting, whether it is rearing brood, clustered, using winter stores etc.
The principle could not be simpler … you insert the Varroa tray, wait a period of days, remove it and examine the hive debris that has fallen through the mesh.
Low, medium or high mite drop?
Depending upon the your imagination detective skills, the quality of your floor/tray, the time of the season, your location, the state of your colony (expanding, broodless etc.) and its health, you can see all sorts of things … some of which are more or less interpretable.
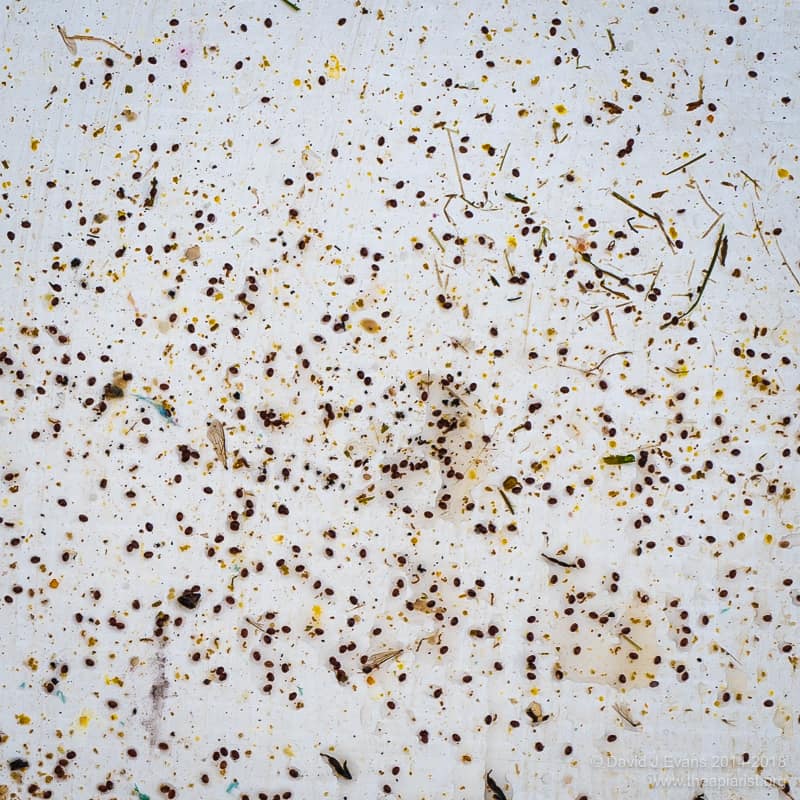
Pollen, chalkbrood mummies, dark-coloured wax cappings, pale or white wax cappings, Varroa, Braula, mouse droppings, legs, wings and antennae {{1}}.
You might also find sticky pools of semi-liquid fondant, slugs, dead bees, live ants, hibernating wasps or surprised mice.
There may be a distinct pattern to the debris, or it might be randomly scattered across the Varroa board.
Before tackling the primary topic of this post – natural mite drop {{2}} – I’ll make a couple of semi-related observations on the floor itself and on some of the things other than Varroa you sometimes find on the Varroa tray.
The influence of the floor
Deciphering the hive debris partly depends upon it staying where it falls, rather than being scattered by gusts of wind, or spread about – or even stolen – by ‘visitors’.
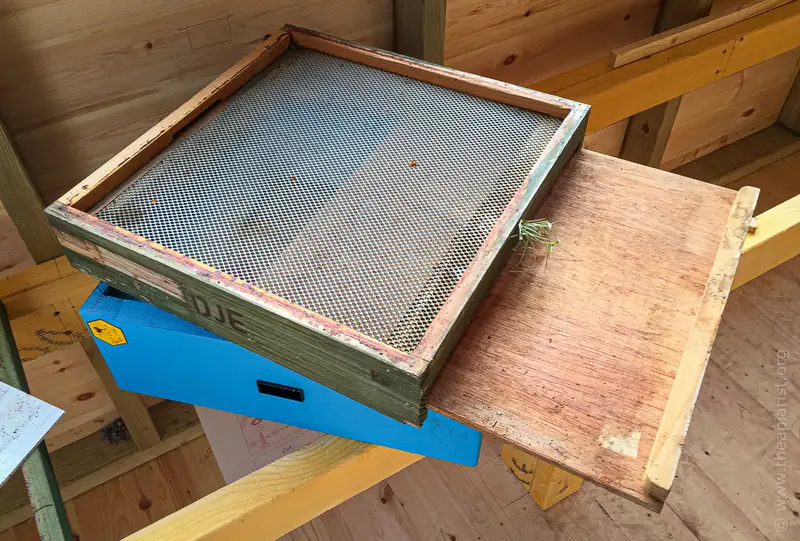
Excellent Pete Little floor
Several of my floors have a tightly fitting plywood tray. These floors are almost perfect, at least for monitoring the debris that falls through and for treating with vaporised oxalic acid. Many of the remaining floors have two lateral rails which support the Varroa tray. The latter has a small gaffer tape ‘handle’ which is pinned to the rear of the floor, closing any gaps. Both these floors can be used with ‘dry’ Varroa trays.
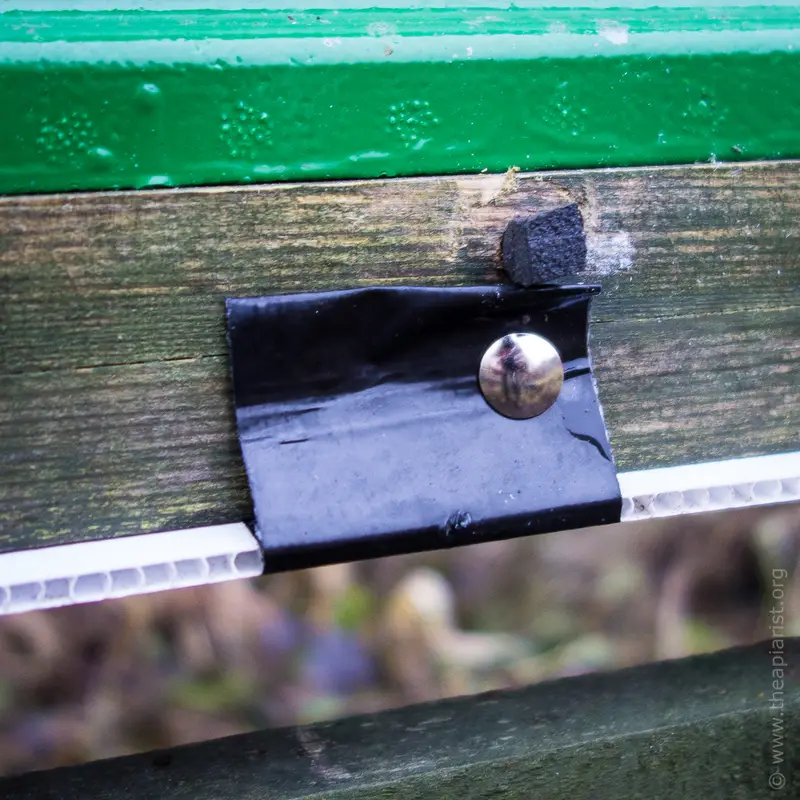
Tightly fitting Correx tray
In contrast, trays surrounded by gaps through which the wind or ‘visitors’ can get need to be made sticky, typically by spreading a thin layer of vegetable oil on them. Debris sticks to the floor, though visitors like ants or other insects, slugs or mice can still remove some of the debris, or otherwise disturb it.
What falls through the OMF is also influenced by the size of the holes in the mesh. If your colony has chalkbrood, the mummies will only fall through if the mesh is relatively coarse.
Normal debris
I’ve recently discussed determining whether the colony is rearing brood. I don’t propose to write a comprehensive review of all the other stuff you can find on a Varroa tray during the season.
Or, for that matter, a superficial review of almost any of the other stuff.
However, I will mention three things:
- Fondant – if there are sticky pools of fondant on the tray it suggests the block (presumably above the colony) is absorbing water and so going gloopy {{3}} faster than the colony is able to eat the fondant. I’ve seen this in two situations; weak colonies topped with large blocks of fondant or colonies clustered in persistently cold and very damp conditions. Either might need attention.
- Mouse droppings – if the tray has scattered mouse droppings then it should be checked pronto.
- Braula – if you live in a Varroa-free area, or border a Varroa-free area and rarely treat with miticides, you may see Braula on the tray. Braula – the ‘bee louse’ – is actually a wingless Dipteran fly. It’s not clear whether they cause any harm to bees. At first glance, unless you have very good eyesight, they look similar to Varroa, though the legs of Braula protrude more than those of Varroa. Braula probably deserves a post of its own, particularly because my autocorrect wants to change it to Dracula.
For the majority of us, the normal hive debris will include Varroa.
How do they get there and what – if anything – can you interpret about the health of the colony from the numbers of Varroa on the tray?
Varroa replication cycle in brief
I’ve discussed the reproduction cycle of Varroa in a post in 2018. It’s not changed since then. The key points are as follows:
- drone brood is 10 times more attractive to mites than worker
- a mated female (the foundress) enters a cell containing a larva 1-2 days before capping
- during pupation, eggs laid by the foundress hatch. The first is a male, followed by several females at ~30 hour intervals
- mating occurs and, when the cell is uncapped (either when the bee emerges, or by a worker clearing out a dead pupa) the progeny mites are released (the male mite dies)
- infested worker cells produce an average of ~1.4 mated female mites, drone cells release ~2.4 (in both cases, plus the foundress mite) … all these females may reinitiate a new round of infestation
- but before they do, mites must spend 5-11 days maturing associated with (mainly) young worker bees during the misnamed phoretic stage of the life cycle
Anyone with a grasp of exponential growth will realise that a single mated female mite could generate a population of thousands (actually ~6000 to ~200,000, on worker or drone brood respectively) within 6 months or 10-12 generations.
That they do not generate populations that big, that fast, has a lot to do with the loss of mites due to:
- uncapping/re-capping activity by workers {{4}}
- high levels of male mite infertility
- loss from the hive of phoretic mites on foragers missing in action
- the finite lifespan of the foundress mite(s)
- production of non-viable progeny mites
- grooming and mite loss
All of the above are very welcome as they all reduce expansion of the Varroa population. However, it’s the last two (or perhaps three) of these that are relevant to natural mite drop.
Natural mite drop
The natural mite drop is a count of the number of mites that are found on the Varroa tray during periods when miticides are not being used.
At steady state i.e. the colony is neither expanding nor contracting and with a number of assumptions about the mite population then the natural mite drop must reflect the total number of mites that infest the colony.
For example, if you assume that foundress mites can typically initiate 3 rounds of reproduction, that a certain percentage of progeny are non-viable and a different percentage of mites are lost with foragers or through grooming, then a colony with a high level of infestation will have a higher natural mite drop than one with a low level of infestation (with the same assumptions).
Of course, it’s not that simple.
Mites exhibit preferences for certain cells (or, presumably, the larvae they contain) and consequently are not randomly distributed in comb. Instead, they occur in aggregates, with multiple foundress mites per cell in heavily infested colonies.
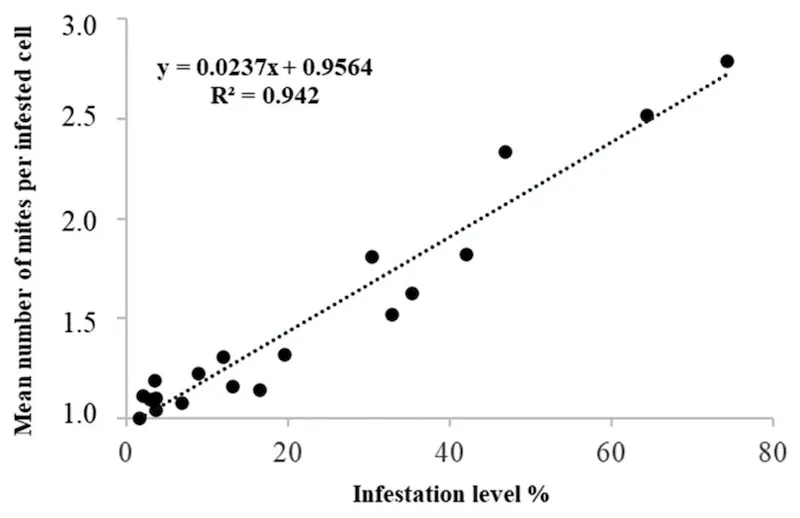
Multiple cell occupancy and infestation levels (Floris et al., 2020)
Pretty obviously, there’s a direct relationship between the infestation level and the number of these multiply occupied cells.
What is less obvious, but now well documented (e.g. Floris et al., 2020, and citation therein), is that cells that are multiply occupied have a reduced reproductive rate for these foundress mites.
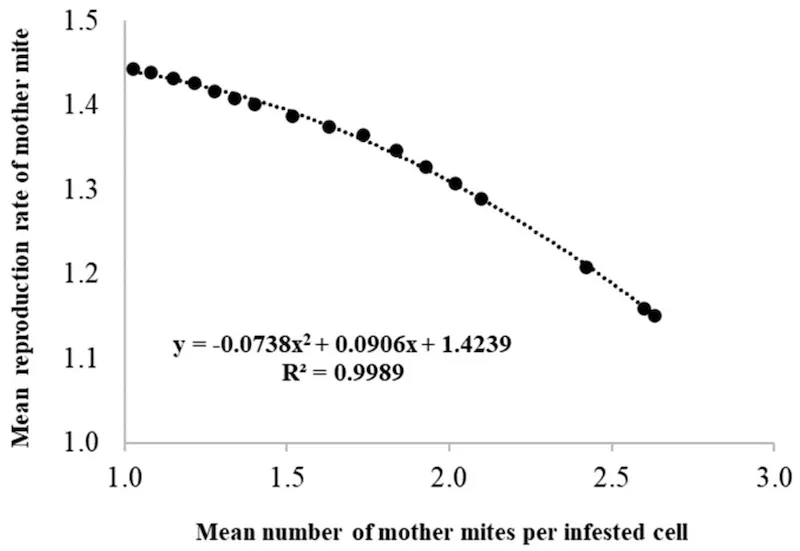
Multiple cell occupancy and reduced mite reproduction (Floris et al., 2020)
But don’t feel sorry for them … co-occupancy allows genetic recombination (due to non-incestuous matings ((There might be a better scientific term for this.)) ) which probably benefits the mite population.
Let’s not worry too much about all these assumptions … what are the typical levels for natural mite drop?
Hold on … daily and average natural mite drop counts
Just before we look at some data, I’ll briefly mention daily counts and average counts.
Anyone who has counted the natural mite drop on a day-to-day basis will know that it is highly variable.
On seven successive days a colony could drop 12, 23, 19, 9, 12, 11 and 29 mites. Randy Oliver (of www.scientificbeekeeping.com) reports up to 250% variation. For this reason, averages of mite drop per day should be calculated over multiple days.
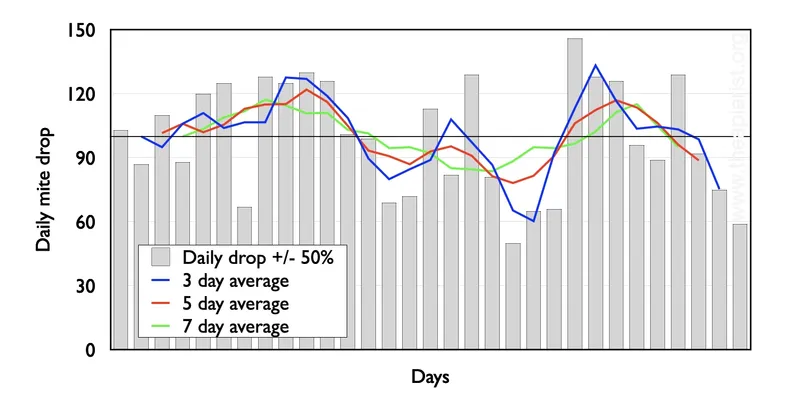
Effect of 50% variation in natural mite drop counts (and averages)
Here are some figures to illustrate this point. Daily mite drop (grey bars) is shown, together with the mite drop averaged over 3 (blue), 5 (red) and 7 (green) days.
The longer the period (e.g. the green vs. blue lines) the smoother – by which I mean more similar from day to day – the numbers are. However, even for the 7 day line, the average daily mite drop varies from 86 to 125.
Maybe this made up data is atypical?
Absolutely not; the daily mite drop was set at 100 and randomly varied by no more than +/- 50% (cf. up to 250% quoted above).
Why are these natural drop counts so variable? It’s partly due to changes in the state of the colony (see below), but also due to the stochasticity (randomness within a range) of things like grooming, mite fecundity and foundress longevity. A day when more grooming occurs, when more non-viable mites emerge and when more foundresses die will have a higher mite drop.
Remember this when you are counting mites. The longer you count for – within reason – the more representative the count per day will be.
OK … now back to the question … “what are the typical levels for natural mite drop?”
It depends …
It turns out that’s not a very easy question to answer as there are so many variables.
However, Delaplane and Hood (1999) studied natural mite drop in untreated colonies, and in colonies treated at particular times of the season. Remember, this was the early days of Varroa research and scientists were trying to determine optimal treatment regimes (they still are).
I’ve graphed the relevant data from the Delaplane and Hood paper to make it easier to digest. I’ve plotted the total number of mites in the untreated colony (horizontal axis) versus the 20 hour mite drop (percentage of total).
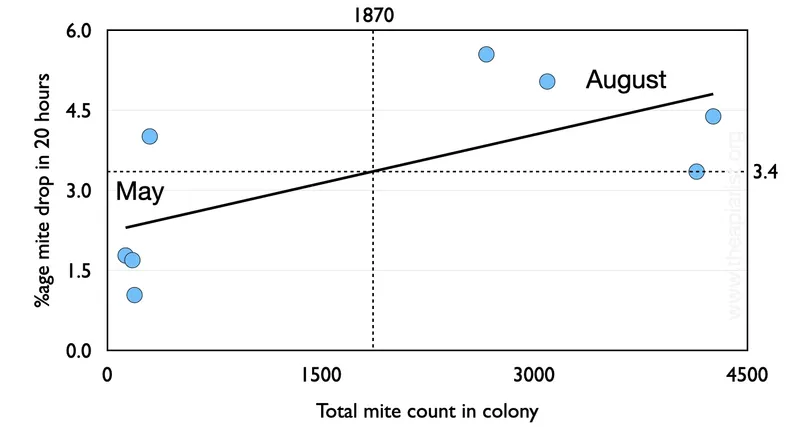
Colony total mite counts and natural drop (modified from Delaplane and Hood, 1999)
I’ve also simplified the data considerably. Each point represents several sampled colonies.
Early season sampling (the four points on the left of the graph, labelled ‘May’) had low overall mite levels and a daily drop a bit over 2%. Later in the season (‘August’) colonies unsurprisingly had much higher mite levels – averaging ~3,500 – and dropped an average of 4.6% of this number per day.
The vertical and horizontal dashed lines represent the average total mite count (1870) and daily percentage mite drop (3.4%).
In my calculations below I’ve assumed a daily mite drop of 3.4%.
Phoretic mite levels
A proportion of the daily natural mite drop is due to workers self- or allo-grooming phoretic mites {{5}}. Therefore, a colony with a high proportion of phoretic mites would be expected to have a higher natural mite drop.
Phoretic mite levels vary considerably during the season, reflecting changes in the level of brood in the colony.
At some point during the winter, at least in northern latitudes, colonies are temporarily broodless. By definition, at this time all the mites in the colony must be phoretic. There’s nowhere else for them to be.
Conversely, at other times in the season, when brood is abundant – particularly drone brood – the phoretic mite population is much smaller, essentially being only the mites that are going through their 5-11 day phoretic maturation period.
Typically, a figure of 10% is often quoted for the proportion of phoretic mites at the height of the season.
In the Delaplane and Hood (1999) study phoretic mite levels were appreciably higher than this during sampling in May and August, ranging from 17-72%. I’m not sure if this is typical of Georgia, USA (where the study was conducted) but thought I should mention it. With one exception (the ‘May’ sample with the high mite drop) the percentage of phoretic mites dropped per day was 3-9%.
Brood breaks
The level of emerging brood in an infested colony will profoundly influence the natural mite drop. This can be trivially illustrated using an Excel spreadsheet …
Remember that the brood cycle of the honey bee is fixed – 3 days as an egg, 6 as a larva and 12 as a pupa.
Nectar dearth
For example, assume that a dearth of nectar occurs; the laying rate of the queen drops from 1000/day over 5 days, she doesn’t lay for 7 days and then takes a further 5 days to reach ‘full speed’ again once the nectar flow restarts. In addition, assume that there are a total of 1000 mites in the colony (with no increase due to reproduction, or reduction due to losses such as mite drop {{6}} ), that no more than 10% of brood cells can be infested, and that the baseline proportion of phoretic mites is 10%.
Still with me?
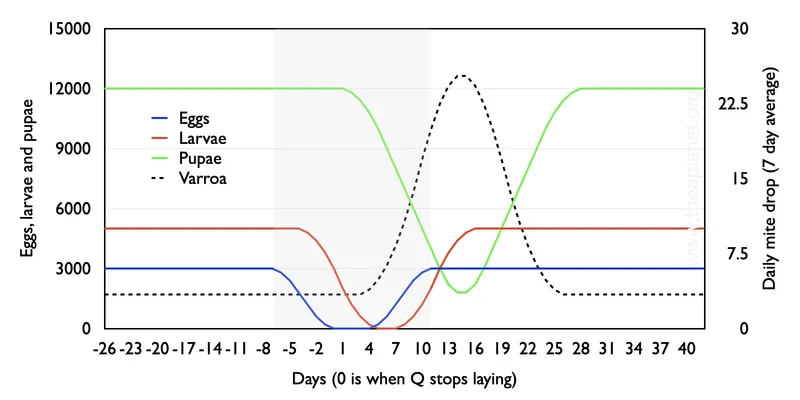
Nectar dearth and reduced sealed brood levels
With only 7 days with no egg laying the colony is never broodless. Egg (blue), larva (red) and pupal (green) numbers decrease as expected, and the average daily natural mite drop (black dashed line) increases from ~3.4 per day to over 25 per day when sealed brood levels are minimal. That’s a 7-fold variation depending upon the presence or near-absence of brood, accepting the caveats and limitations of the calculations.
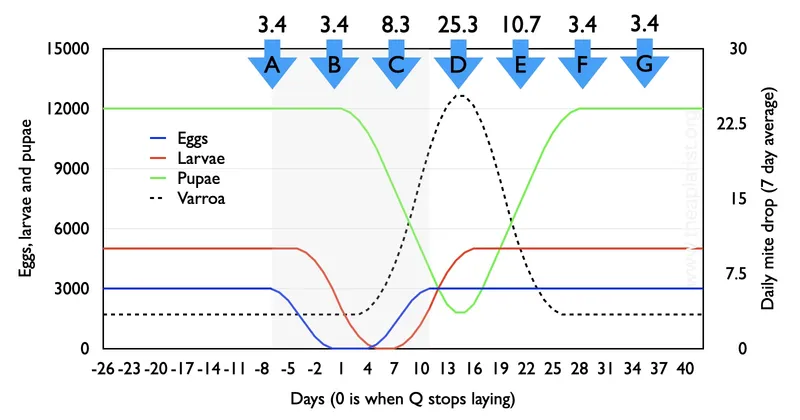
Influence of reduced sealed brood levels on daily average counts of natural mite drop
If you knew nothing about the nectar flow and the brood status of the colony your interpretation of the mite infestation level would be greatly influenced by the week(s) you quantified the natural mite drop (A to G, above).
Loss of the queen
One day she’s there, the next day she’s gone …
If you accidentally (or deliberately) kill the queen, the colony will immediately produce emergency queen cells. It takes 16 days for the queen to emerge, a couple more for her to mature, before her orientation and mating flights. She will start laying a couple of days after that. Even a wildly optimistic beekeeper would expect it to take at least 21 days for a new queen to start laying … which is the duration I’ve chosen below.
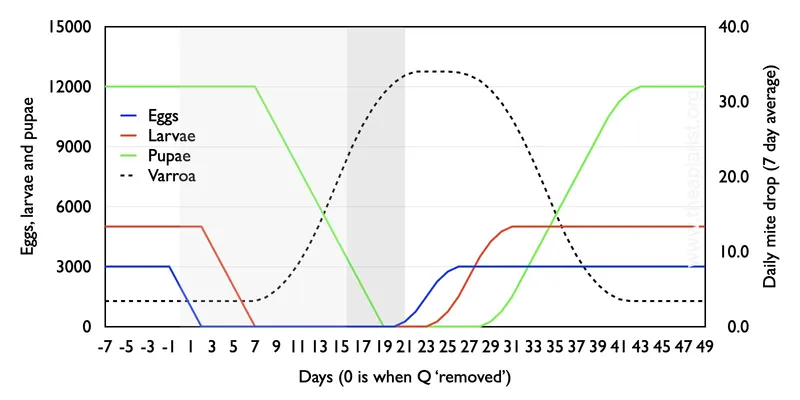
Loss of the queen leads to extended broodless period – influence on natural mite drop
It’s a similar story, though this time the colony has no sealed brood (green line) for a period of ~12 days. Consequently, taking account of all the assumptions, at certain times the daily mite exceeds 30 and extends at this level for a longer period.
Caution
The purpose of writing this post was to emphasise that the natural daily mite drop is:
- highly variable and so should always be averaged over several days
- very dependent upon the state and activity of the colony
- indicative only
None of the numbers I’ve used in the graphs above are ‘real’ data, though all are broadly in line with published studies; natural daily drop (from Delaplane and Hood, 1999), 10% phoretic mite levels (numerous studies, but also see below), queen egg laying rates etc.
However, these idealised colonies contain no drone brood, there’s no mite reproduction (both of which would increase phoretic mite levels over time), no phoretic mite losses due to grooming or worker death, and no brood uncapping (all of which would decrease phoretic mite levels).
None of this means that the natural mite drop is not of some use. If you know something about the brood status of the colony it is at least broadly indicative of the overall infestation level.
More assumptions and unanswered questions
If the natural mite drop is very low things get more complicated. Once you’re down to 1’s or 0’s per day the level of brood infestation (and the other variables I mentioned, but almost entirely ignored) has a greater influence.
At least you can take comfort from the fact that you cannot have consistently low average daily natural mite drops unless there are very few mites in the colony. Varroa must go through a phoretic stage in their lifecycle … if the duration of this phase is reduced, their fecundity drops.
I’m more interested in situations where there are high phoretic mite levels and low levels of brood.
What happens to the first brood produced after a broodless period in a heavily infested colony?
For an individual mite it would make sense to infest a pupa and get breeding ASAP. However, at the population level, if all the mites did this the infestation level would be so high – with multiple mites entering each infested cell – that all the brood would likely perish … as an evolutionary strategy this isn’t going to end well for either the mites or bees.
This scenario could occur when a newly mated queen starts laying (see the graph above) or as a colony shifts from a winter broodless period to the start of spring expansion.
I’ve not managed to find anything in the literature about brood infestation rates under these circumstances or during late autumn, winter or early spring. Maybe no-one has looked?
Conclusions
Do not blindly accept the natural mite drop as being accurate unless you know quite a bit about the brood level and activity of the colony. All sorts of things can adversely influence it.
At best consider them indicative – low, middling, high or Yikes!
It’s worth finally noting that several studies have shown that the natural mite drop underestimates the phoretic Varroa level in a colony when the latter is quantified by alcohol wash, sugar dusting or CO2 methods.
You have been warned.
I’ll be returning to some of these other methods to count Varroa later in the season.
Note
While preparing this post I searched the National Bee Unit’s site for their “Varroa calculator”. I couldn’t find it anywhere. Perhaps it was a victim of their chaotic website reorganisation last year where they moved servers and simultaneously broke every existing link to anything other than their homepage?
There is a PDF on estimating Varroa populations (search for FAQ 12 ‘Estimating Varroa Mite Populations’ which even mentions the non-existent calculator!) which suggests taking the May – August average daily drop and multiplying it by 30 to get the total mite number in the colony.
Extrapolating from Delaplane and Hood’s 3.4% average daily drop figure quoted above this would would mean a colony dropping over 30 mites a day in midsummer – like that queenless colony above – would be fast approaching the ‘1000 mites in the colony’ threshold at which the NBU suggests treatment is required (or ‘used to suggest’ as I can’t find that page either … though it is mentioned in their Managing Varroa Advisory Leaflet). However, applying the same 30x multiplier to a colony with brood (e.g. before the queen disappeared) would woefully underestimate the total mite population. This may well reflect the (considerable) limitations of my model calculations, but does not alter the fact that the presence or absence of signficant levels of brood can fundamentally alter the daily natural mite drop.
I had hoped to plug a bunch of numbers into their Varroa calculator, varying the brood level and month, to see how they thought the presence of brood impacted natural mite drop. But it was not to be 🙁
However, I did find a map of colony density for every 10 km square in the country … interesting. This might make my ‘back of an envelope’ calculations of apiary to colony density redundant.
References
Delaplane, K., and Hood, W. (1999) Economic threshold for Varroa jacobsoni Oud. in the southeastern USA. Apidologie 30: 383-395 https://doi.org/10.1051/apido:19990504
Floris, I., Pusceddu, M., and Satta, A. (2020) How the Infestation Level of Varroa destructor Affects the Distribution Pattern of Multi-Infested Cells in Worker Brood of Apis mellifera. Vet Sci 7: 136 https://doi.org/10.3390%2Fvetsci7030136
{{1}}: What have I missed?
{{2}}: The clue was in the post title.
{{3}}: The correct technical term.
{{4}}: Don’t ask … this needs a separate post.
{{5}}: Allo-grooming is one worker grooming another worker.
{{6}}: I never claimed this was realistic!
Join the discussion ...