Interpretative dance
Synopsis : Interpreting waggle dance distances as indicators of seasonal foraging challenges, environmental change and pollinator competition.
Introduction
The days are getting longer, though not enough to really notice. At almost 57° N we’ve apparently gained ~26 minutes since the winter solstice … but I’ve not seen a bee since early December.
Actually, that’s not entirely true because I checked some colonies this afternoon. As well as hefting the hives to ensure they were still reassuringly heavy I also took a couple of photos from underneath the open mesh floors.
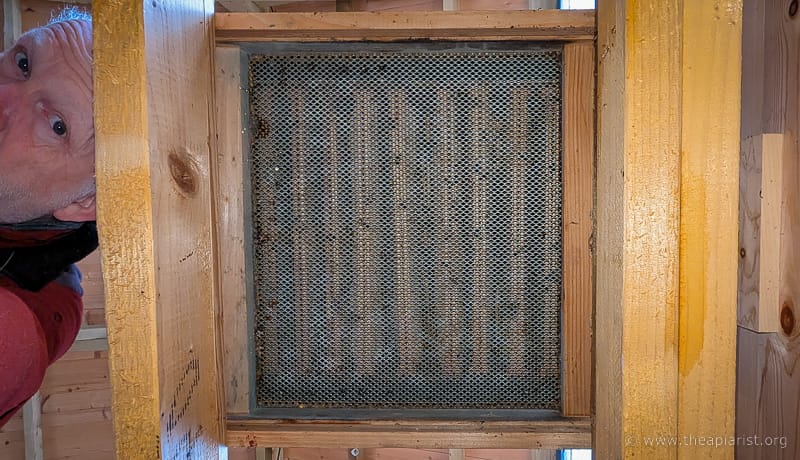
Late December and relatively few corpses on this OMF in the bee shed
Some floors were almost clear, others had a few hundred scattered corpses and there was even the odd bee wandering around.
Why do some floors have more corpses than others?
Remember, the entire worker population of the colony is replaced in the autumn, with the summer foragers gradually dying off and the the long-lived (diutinus) winter bees substituting for them. It’s unlikely that these corpses are summer bee stragglers as they’d be almost three months old by now.
One possibility is that there is a higher attrition rate of winter bees in some colonies (though why is unclear), or the colonies were larger to start with and the same attrition rate yields more corpses. A related explanation would be colonies with the same number of winter bees, though produced at different times. If 1% of bees over, for example, 2 months old died each week {{1}}, a colony that produced the bulk of its winter bees early would have more corpses than one that produced the winter bees later.
The photobombed picture above is of one of my east coast colonies in the bee shed. Here on the west coast my bees are Varroa-free. The ‘corpse count’ is therefore unlikely to be due to different levels of DWV infection resulting from Varroa infestation. My west coast bees have DWV, but only at very low levels.
It’s also not due to differences in undertaker bee activity as temperatures have been too low for any bees to fly for at least a month.
Anyway, enough morbidity …
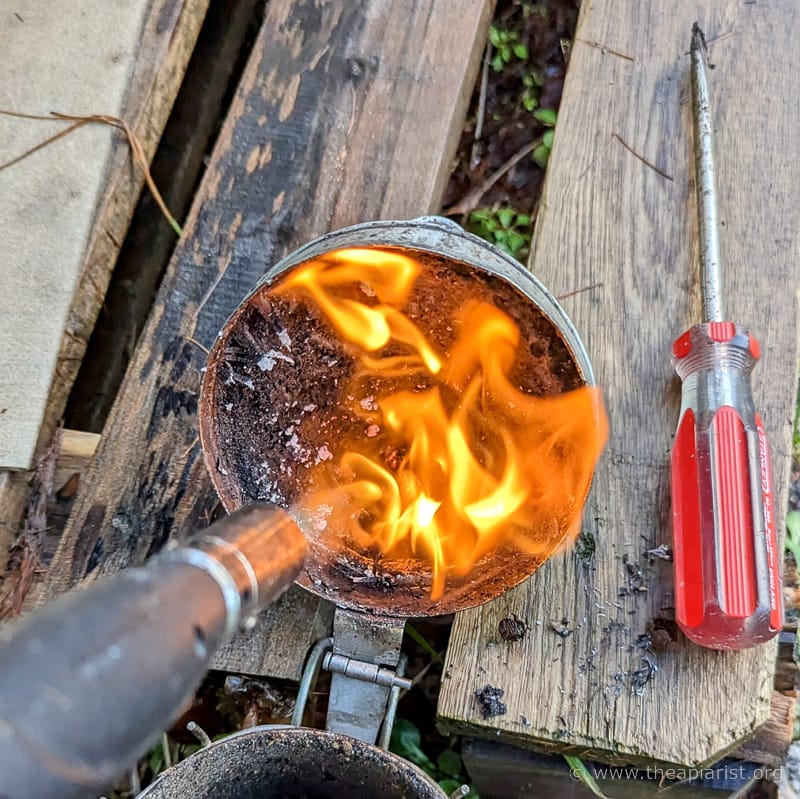
The ‘corpse count’ is hardly beekeeping, but it’s as close as I’ll get to do any for at least two months. There are always winter tasks … cleaning smokers, frames, wax processing, honey jarring, painting nucs etc. but enthusiasm levels are low and it’s easier to sit in front of the fire and drink coffee 😉 .
My good deed for the day
To take my mind off corpses and all the frames I’ve yet to start building I’ve been doing some reading about foraging distances and how they vary during the season. This is great because it makes me think of summer days, wildflower meadows, fields of clover and acres of flowering oil seed rape.
By coincidence, this morning there were two articles in The Guardian – on deaths attributable to pollinator decline and severe weather events. It struck me that a better understanding of changes in foraging patterns and activity may be informative in investigating both the decline of pollinators and the consequences of severe weather events like drought.
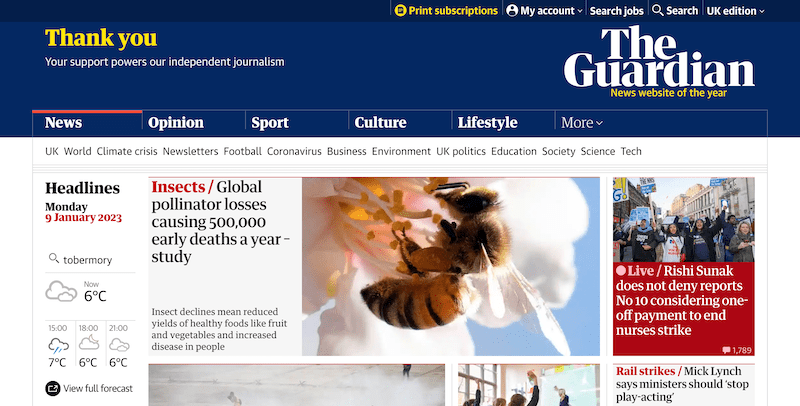
Front page news … The Guardian 9th January 2023
I’ll return briefly to these two articles at the end, but will concentrate upon how we can determine where the bees are foraging and how this changes during the season.
And, even if you would rather not think about potential ecosystem collapse or climate disaster, from a beekeeping perspective it’s just interesting to know how far our bees are going when they zoom out of the hive entrance on a balmy summer afternoon.
It’s good to talk
Although we can communicate with animals to an extent – I can tell our puppy to ‘sit’ (and she might) – it’s not true communication. Similarly, although we can recognise the differences in songbird alarm calls to sparrowhawks vs. cats, the informational content is extremely limited when compared to true communication.
In contrast, and perhaps uniquely, we can eavesdrop on communication by returning foragers with their nest mates and interpret the distance to the nectar or pollen source, the direction the source is from the hive and – to an extent – the quality of the source (I’m going to restrict discussion to distance and direction here).
All of this information is encapsulated in the waggle dance, for which von Frisch was awarded a Nobel Prize in 1973. Without question this is the most complex communication signal known in insects and, arguably, in any animal.
The waggle dance has two phases; the waggle run is essentially movement in one direction while vibrating the abdomen from side to side, the return phase involves the worker looping back to start another waggle run.
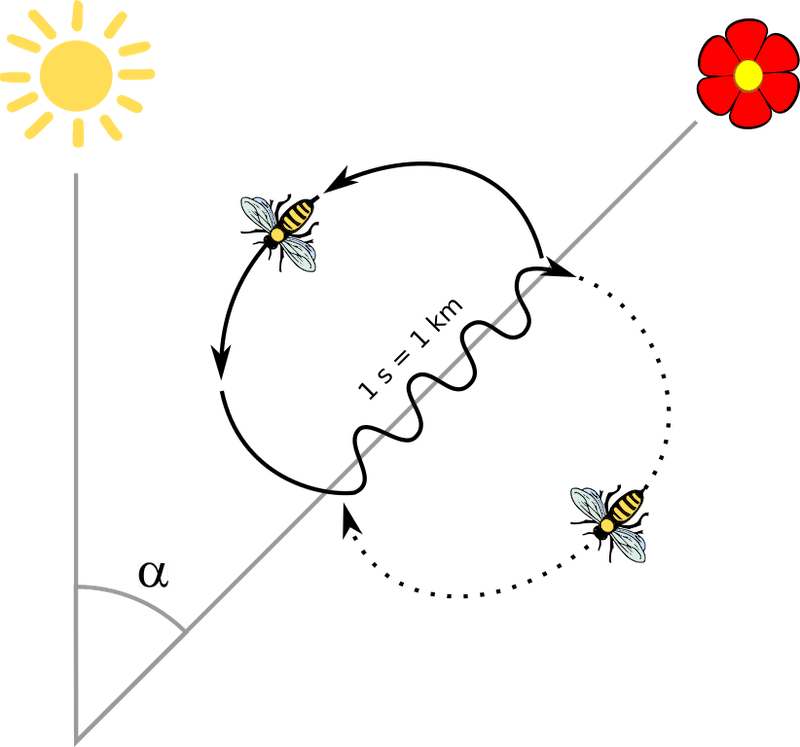
The waggle dance
The informational content of the waggle dance is primarily in the waggle run, the:
- duration of the waggle run provides distance information
- angle of the waggle run provides directional information, relative to the solar azimuth
By keeping bees in a hive with a glass observation panel and videoing waggle dances we can determine the likely location of nectar or pollen (or tree resins or water under certain conditions) sources after analysing the recordings.
Noisy dancing
However, although it sounds relatively straightforward, dance interpretation is complicated by the inherent noise in the dances of returning foragers.
Foragers returning from a point source of nectar (such as a syrup feeder placed in the field by a scientist) show variation in their waggle dances; both individual foragers in sequential dances, and different foragers reporting the same nectar source.
When decoded this means there is variation in both vector components – distance and direction.
All of which makes accurately monitoring changes in foraging distances over a season or more rather problematic.
However, before describing how scientists have solved this problem think about whether this matters to a bee.
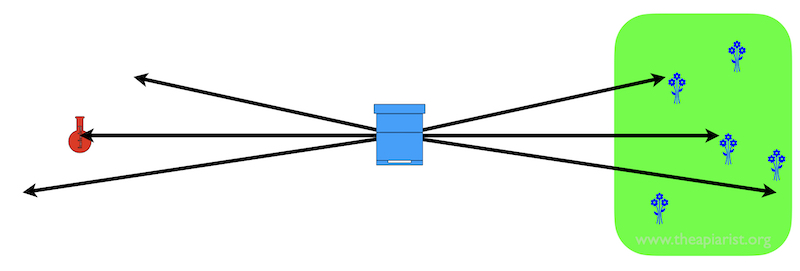
A bit of noise is OK for the bees (right) but just looks like noise to scientists (left)
In nature, although individual locations of nectar {{2}} might be point sources e.g. a flower in a field, in reality the entire field may be filled with similar nectar-yielding flowers. Typically bees rarely have to return to the reported location of a point source.
As long as the dance followers get to the right field they should be OK.
Noise suppression and increasing probability
Using a syrup source to which a colony had been trained, Couvillon and colleagues (Couvillon et al. 2012 {{3}} ) demonstrated that the first and last waggle runs within any one dance were not very accurate. If these were ignored, but instead four consecutive runs were used from a single dance, this gave much better prediction of the syrup source.
However, this decoded directional and distance information (e.g. 1100 metres at 46°), when plotted onto a map, still just indicates a point source, effectively over-estimating the confidence in the decoded information.
Instead, they reasoned, it would be better to predict a probability distribution.
Roger Schürch did this (Schürch et al., 2013), analysing his own data and published archival data from both von Frisch and Wenner (I introduced you to Adrian Wenner a few months ago when I discussed using Varroa to eradicate honey bees from Santa Cruz Island).
Using some clever {{4}} statistical analysis Schürch showed that; 1) there was a linear relationship between the duration of the waggle run and distance, 2) that angular variation between dances was independent of distance, and 3) that the combination of the two vectors (from several recorded dances and several thousand dances simulated with appropriate levels of scatter in the distance and angle vectors) could be used to plot a probability distribution of the location the bees were reporting during the dance.
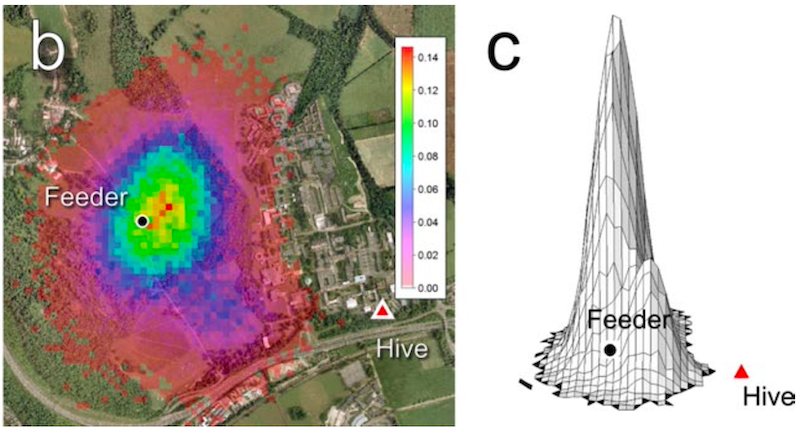
Heat map (b) and 3D representation (c) of combined multiple dances
Effectively this method enables a relatively limited dataset to predict the most likely location of the nectar source – in the image above, blue is less likely than yellow, than red.
As you can see from the 3D projection – where probability increases in the vertical axis – it looks pretty good.
Dance like nobody’s watchin’ {{5}}
Though there usually is 😉 .
Margaret Couvillon and Roger Schürch worked with Francis Ratnieks at the University of Sussex. Together they applied this methodology to predict the likely foraging areas by conducting waggle dance observations over two full seasons (Couvillon et al., 2014).
They recorded over 5000 dances to track seasonal changes in foraging and so address these questions:
- how do foraging areas change over the season?
- are foraging distances influenced by temperature?
- how might nectar quality influence foraging?
Of course, as soon as you start thinking about questions like these you’ll realise that the observations will inevitably reflect the locally forage available, so the direct results may not be applicable to different areas, but the patterns might be.
And importantly, the methodology may be useful to address other questions in a changing landscape and environment.
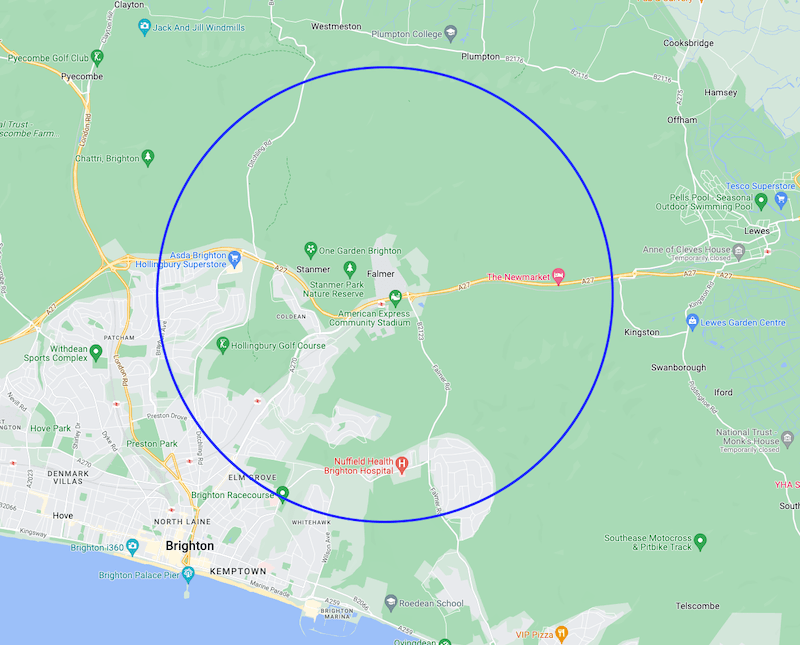
4 km circle around the hive location – note urban and rural areas
The hives were located at the University. This was an area surrounded by open farmland {{6}}, but Brighton has encroached from the south west. As a consequence at least ~21% of a 4 km circle centred on the University is classed as urban or suburban i.e. built up, but including gardens and allotments etc.
Seasonal variation in foraging distances
From August ’09 until July ’11 (excluding the months between November and March which are too cold for regular foraging) 5076 dances were videoed and analysed. By plotting the average distance reported {{7}} by returning foragers each month, it was clear that bees traveled much further afield in the summer than they did in either the spring or autumn.
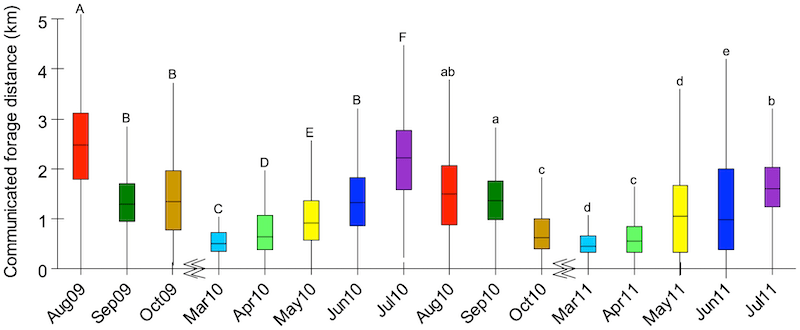
Monthly differences in foraging distances
The average distances for early spring (March), summer (July/August) and autumn (September/October {{8}} ) were 493 m, 2156 m and 1275 m respectively.
Temperature and foraging
Although summer is the warmest season, there are warm days in spring and cool days in summer. Since the team recorded dances on almost every day good enough for foraging it was possible to look for a correlation between the actual temperature and the distance reported by dancing foragers.
There wasn’t one.
That means that the longer flights in summer were not because the bees needed a higher ambient temperature to fly further. We can therefore assume that the bees were choosing to fly further, not because they could but because they had to.
Nectar and foraging
Honey bees are able to judge the energetic rewards of a nectar source. This involves a calculation of the energy expended collecting it vs. the energetic ‘value’ of the nectar collected. For example, the bees might favour a distant sugar-rich nectar source over a poorer one that is closer.
It was therefore important to determine whether the increased summer foraging distances were because the bees were favouring nectars with a higher sugar content.
How was this determined?
Returning foragers {{9}} were captured, chilled and gently squeezed to force them to regurgitate the content of their crop. Using a refractometer (of a slightly smaller scale than you might use to measure the water content in a bucket of honey) the sugar content of the crop contents was measured.
About 5% of returning foragers were carrying water, not nectar, and these were excluded when calculating average nectar content.
Whilst there was considerable month to month variation in the sugar content of nectar, there was not a correlation with the foraging distance. Therefore, the bees foraging further afield in the summer weren’t travelling greater distances because the distant nectar sources had a higher sugar content. They were travelling that far because they had to.
The sphere of influence
I used this term previously to describe the area of the landscape potentially impacted by a hive or apiary. Essentially it is defined by the maximum flight distances of the foragers, drones, scouts and queens. Numerically of course, the foragers are the largest group.
Using the methods described above the authors plotted ‘heat maps’ of foraging areas in spring, summer and autumn. The colour scheme is the same as that used above (essentially a probability map of likely foraged areas) – blue is predicted to be the least visited area (though see also the note below), yellow gets more attention and red gets the most.
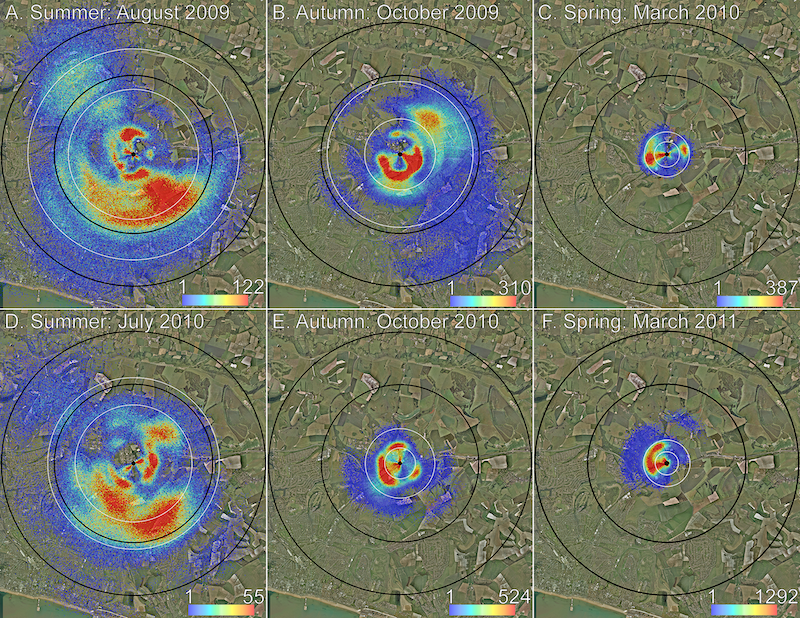
Heat maps of seasonal differences in foraging – black circles denote 3 and 5 km from hive
There is clearly a big difference in the area visited by foragers in spring (0.8 km2), summer (15.2 km2) and autumn (5.1 km2), and this difference is not because the bees are going further to collect better quality nectars, or because the long hot days of summer encourage them to travel further from the hive.
As an aside … I’d have liked to see this data normalised somehow to forager numbers (which vary over the season) to get a better idea of potential competition for nectar or pollen resources with other pollinators.
It’s worth noting that not all foragers dance, but those that do report the best quality nectar sources. Therefore the maps above, and the distances I discussed even further up the page, represent the best choices the bees have in different parts of the season.
There may be poorer quality nectar sources not mapped by this type of analysis.
Summertime and the livin’ is easy
These studies show that – at least in this particular environment – honey bees have abundant forage close to the hive in early spring. In summer the bees have to forage over an area ~22 times larger {{10}} than in early spring to collect the resources they need.
Since the nectar sources are no better the livin’ is anything but easy.
Once the ivy starts flowering (mid/late August in this part of the world) then things get appreciably better and the bees don’t need to travel so far.
There’s no discussion in the paper on the areas foraged, or the potential sources of nectar (other than the ivy), or hive weight changes (which would have been really interesting). However, it seems likely that the large tracts of farmland to the north and east of the hives are very poor in forage during much of the season, and especially in the summer.
The heat maps show that the bees appear to spend more time to the south and the west … both areas where there is the greatest amount of urban development.
Readers with good memories will remember a post explaining the differences in foraging distance between urban and rural bees. The former travelled less far.
Urban environments are often better for bees as there is less boom and bust in terms of available nectar sources.
Generalists
Honey bees are generalists; they can exploit a wide range of nectar and pollen sources. This at least partly accounts for their success and distribution.
Because they are not ‘tied’ to particular flower source(s) they are likely to share many of these sources with other flower-visiting insects, many of which will also be generalists.
It therefore seems likely that the apparent paucity of nectar and pollen sources ‘reported’ by dancing honey bees (who have to travel further to get what they need) will also be experienced by these other pollinators (many of which have smaller home ranges, perhaps 0.25 km2 for Bombus terrestris; see Osborne et al., 2001).
Therefore, rather than conducting time consuming survey work recording which flowers are visited by which pollinators (and when), the overall quality and quantity of nectar and pollen in an environment could be determined by monitoring the distances travelled and areas visited by a few honey bee colonies.
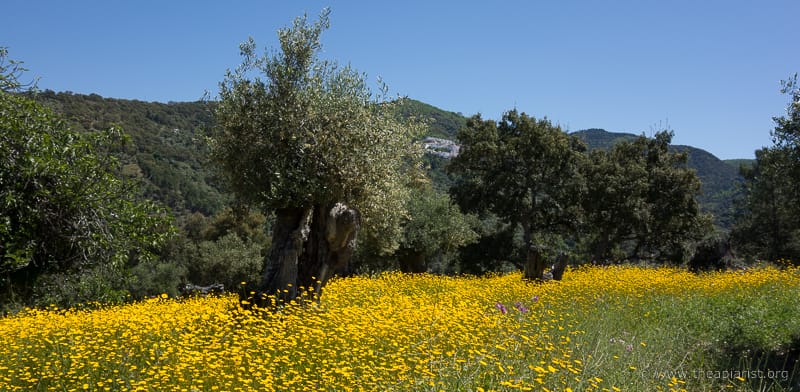
Wildflower meadow (in Andalucia)
Are set-aside and land-management programmes optimised to provide nectar and pollen where and when it needed?
Hmmmm.
Competition and environmental change
One reason proposed for the huge decline in non-managed pollinators is from competition with managed honey bee colonies. Honey bees may be generalists and are actually rather inefficient at pollination (in terms of fruit set per visit), but they more than make up for this by sheer weight of numbers.
The studies showing competition is responsible are not completely clear cut, and there are almost certainly other factors that have a greater influence e.g. persistent pesticides, removal of hedgerows and wild flower meadows.
However, if honey bees are struggling to find suitable nectar i.e. having to travel long distances, it’s likely they may be having a landscape-scale impact on other pollinators competing for the same resources in their own (smaller) ranges.
It’s a little sobering to think that our apiaries may be influencing survival and reproduction of other pollinators kilometres away.
Finally, as our climate changes, repeated studies of this type every few years would provide a very good insight into the degradation of the environment.
We know that the gradual warming of the environment is changing the flowering times of plants. We also know that weather extremes – particularly drought – can have a significant impact on seed set which, in turn, will influence the abundance of plants flowering in the following seasons.
Honey bees are the only indicators of these types of qualitative environmental changes that we can directly listen to and understand.
These things are not often discussed by beekeepers … perhaps they should be?
Note to Facebook users/followers
If you are one of the few hundred that rely on Facebook to get announcements of new posts please instead follow me on Instagram or Twitter or even Mastodon (or subscribe for email notifications – right margin). It is likely that the automagic notifications to Facebook will stop in the next few weeks and I don’t use Facebook as I find it a bit overwhelming shambolic 😉
References
Couvillon, M.J., Riddell Pearce, F.C., Harris-Jones, E.L., Kuepfer, A.M., Mackenzie-Smith, S.J., Rozario, L.A., et al. (2012) Intra-dance variation among waggle runs and the design of efficient protocols for honey bee dance decoding. Biology Open 1: 467–472 https://doi.org/10.1242/bio.20121099. Accessed January 10, 2023.
Couvillon, M.J., Schürch, R., and Ratnieks, F.L.W. (2014) Waggle Dance Distances as Integrative Indicators of Seasonal Foraging Challenges. PLOS ONE 9: e93495 https://journals.plos.org/plosone/article?id=10.1371/journal.pone.0093495. Accessed January 7, 2023.
Osborne, J. l., Clark, S. j., Morris, R. j., Williams, I. h., Riley, J. r., Smith, A. d., et al. (1999) A landscape-scale study of bumble bee foraging range and constancy, using harmonic radar. Journal of Applied Ecology 36: 519–533 https://onlinelibrary.wiley.com/doi/abs/10.1046/j.1365-2664.1999.00428.x. Accessed January 10, 2023.
Schürch, R., Couvillon, M.J., Burns, D.D.R., Tasman, K., Waxman, D., and Ratnieks, F.L.W. (2013) Incorporating variability in honey bee waggle dance decoding improves the mapping of communicated resource locations. J Comp Physiol A 199: 1143–1152 https://doi.org/10.1007/s00359-013-0860-4. Accessed January 9, 2023.
{{1}}: Back of an Envelope Guesstimates™
{{2}}: I’ll abbreviate ‘nectar, pollen, water or tree resin’ to just ‘nectar’ for the remainder of the post. KISS.
{{3}}: References are at the end of the post.
{{4}}: i.e. uninterpretable, by me at least.
{{5}}: Almost certainly originating from Clark and Leigh’s 1987 song Come from the heart … not Mark Twain
{{6}}: When I was there in the mid-80’s.
{{7}}: Remember, this is all done by interpreting the waggle dance … the authors didn’t verify where the bees were foraging, or survey the fields for likely nectar-yielding crops.
{{8}}: Though apparently defined in terms of ivy flowering rather than actual specific months.
{{9}}: Though not dancing foragers … you have to assume these were returning after following dance instructions from another forager.
{{10}}: This is not as simple as 15.2/0.8 … it involves taking account of the distribution of forager density within these areas.
Join the discussion ...