Listening to the bees - swarm prediction
Wouldn’t it be useful to know your colony was preparing to swarm?
With sufficient notice you could take preventative action. You could conduct an artificial swarm or remove the queen to a nuc. With the major population of the hive now queenless the colony cannot swarm, though you will need to prevent casts by ‘discouraging’ too many virgin queens from emerging.
What is sufficient notice?
Certainly more than minutes or hours. You need to have time to collect the equipment you’ll need, you might need to wait until the rain clears, or you return from a long weekend in Rome (remember those?).
Inevitably, 2300 years ago Aristotle had both identified the problem (Are they about to swarm?) and found a way of answering the question.
When the flight of a swarm is imminent, a monotonous and quite peculiar sound made by all the bees is heard for several days {{1}}.
Several days should be enough surely? The fact that you don’t see beekeepers hunched down by their hives listening intently suggests it’s not an entirely practical solution.
Depending where you live, the swarm season can extend from mid-April until mid-July. That’s a long time to be sat next to a hive with your ear glued to the brood box.
Some sort of automated system is needed.
Woods’ Apidictor
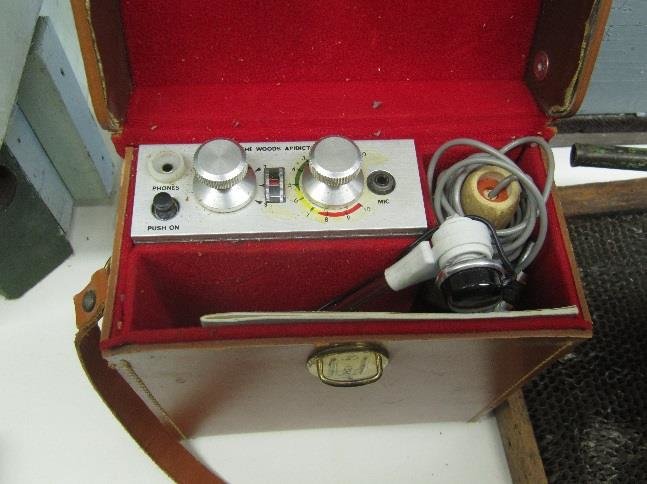
In the 1960’s Edward Woods developed {{2}}, patented and sold an electronic frequency analyser to “listen” to beehives. It incorporated analogue bandpass filters to screen out the background noise of the hive, focusing on the “monotonous and quite peculiar sound” (to quote Aristotle again) characteristic of a colony making swarm preparations.
Woods sold about 300 Apidictors during the early 60’s. Analysing an individual colony took just minutes. In a 1965 article in Bee Craft Eddie Woods claimed that 60 colonies could be screened in 15 minutes.
In the right hands the Woods Apidictor was also accurate, predicting not only whether a colony was going to swarm, but also the particular stage it was at e.g. sealed queen cells present (presumably held back by bad weather), queenless colonies, superseding colonies, or even drone-laying queens {{3}}.
One of the most impressive [demonstrations of accuracy] occurred when one purchaser complained that the instrument was “over-enthusiastic”. Our representative visited him and checked and predicted that seventeen out of twenty colonies in one apiary contained queen cells, even specifying the stage of development of the cells, a test which required only a few minutes. The manual examination, requiring hours, showed that indeed, the situation was as predicted. The three colonies which the instrument showed no swarm preparations were found to be clear. {{4}}
Despite the fact that Woods only ever sold a limited number of Apidictors, the subsequent 60 years have seen continued interest in – literally – listening to the bees.
The internet is littered with commercial and DIY solutions, all in various stages of development. I don’t intend to review them … Google is your friend. Make yourself a cuppa … there are over 2 million hits.
Importantly, the usefulness of this automation depends upon whether sounds in the hive are truly predictive of swarming, and our ability to identify the relevant sound that is predictive.
A monotonous and quite peculiar sound
When using sound as an indicator of swarming activity, false-positives will have us scurrying around performing artificial swarms when unnecessary, and false-negatives will mean the colony swarms.
Not the end of the world, but an irritation certainly.
So, what do we (or, more likely, our Raspberry Pi or Arduino-powered detectors) listen for? What is Aristotle’s “monotonous and quite peculiar sound”?
A recent paper by Martin Bencsik and colleagues addresses this and claims accuracy of greater than 90%, with successful swarming prediction up to 30 days prior to the event {{5}}.
A beehive is a noisy environment. Some of the noises are constant, others vary during the day, or over longer periods. As the colony builds in strength during the early season the noise levels must increase. Similarly, the sound levels in the colony will be different at night than during a bright, sunny day with thousands of foragers working hard.
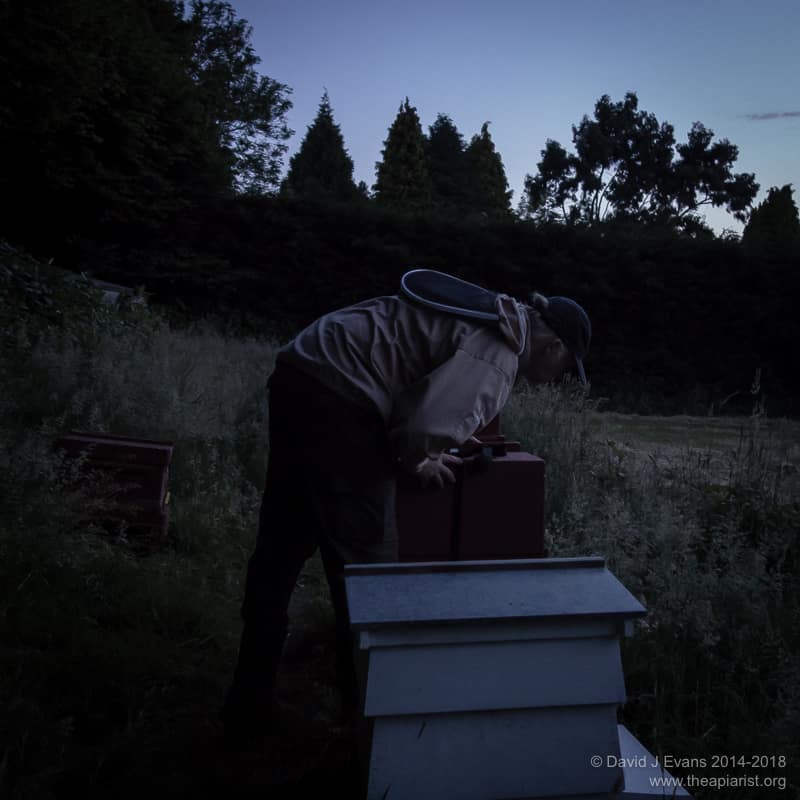
Many beekeepers will be aware of the sound a colony makes at night during a strong nectar flow. The entire hive hums as the workers drive off excess water prior to capping the cells. If you’ve not visited an apiary late on a calm, midsummer evening you should try; the smell of the honeysuckle in the hedgerow mingled with the scent of honey from the hive is a heady combination.
Toots and quacks and buzzes
In addition to the cumulative noises of tens of thousands of bees simply working in the hive, there are the noises individual bees make at certain times.
Scout bees produce piping noises when doing their buzz runs as they encourage a swarm to leave the hive. Queens, in particular virgin queens, produce a variety of noises including duck-like quacks and piping before, during or after emergence. I’ll return to these in a future post as this paper also includes a lot of information on the timing and relevance of queen piping.
And if all that wasn’t sufficiently complicated there are additional acoustic signals such as the intermittent, but extensively repeated,’whooping‘ noise (and others), which may be similar to the ‘stop signals’ workers direct at dancing foragers advertising less than favourable locations.
All of which means you cannot just stick a microphone at the hive entrance and instantaneously determine whether they’re about to swarm.
In particular, the variable nature of sound over time needs to be taken into account. The steadily increasing background noise of a hive building up through the early spring and summer is probably not significant.
In contrast, a spike in the signal averaged over several hours or days is probably important, but there may also be characteristic sounds that – if present – indicate swarm preparation.
In the Ramsey paper the authors have used two machine learning techniques to analyse the sound from accelerometers (something that measures vibration) inside the hive.
Training data
Woods had identified a 250 Hz signal that he considered characteristic of a colony making swarm preparations. Modulation of this signal, which Woods termed “the warble”, in three test colonies was associated with swarming.
Ramsey and colleagues analysed the full spectrum using highly accurate accelerometers in about 25 hives, sampling continuously at 3 minute intervals, over a two year period. About 50% of these colonies swarmed during this time, generating 11 prime swarms and 19 casts.
This dataset was then analysed to find acoustic features characteristic of hives that did or did not swarm. Essentially the authors trained the algorithms to detect particular acoustic patterns that were – through empirical observation – associated with swarming (or not).
To do this they used two separate approaches:
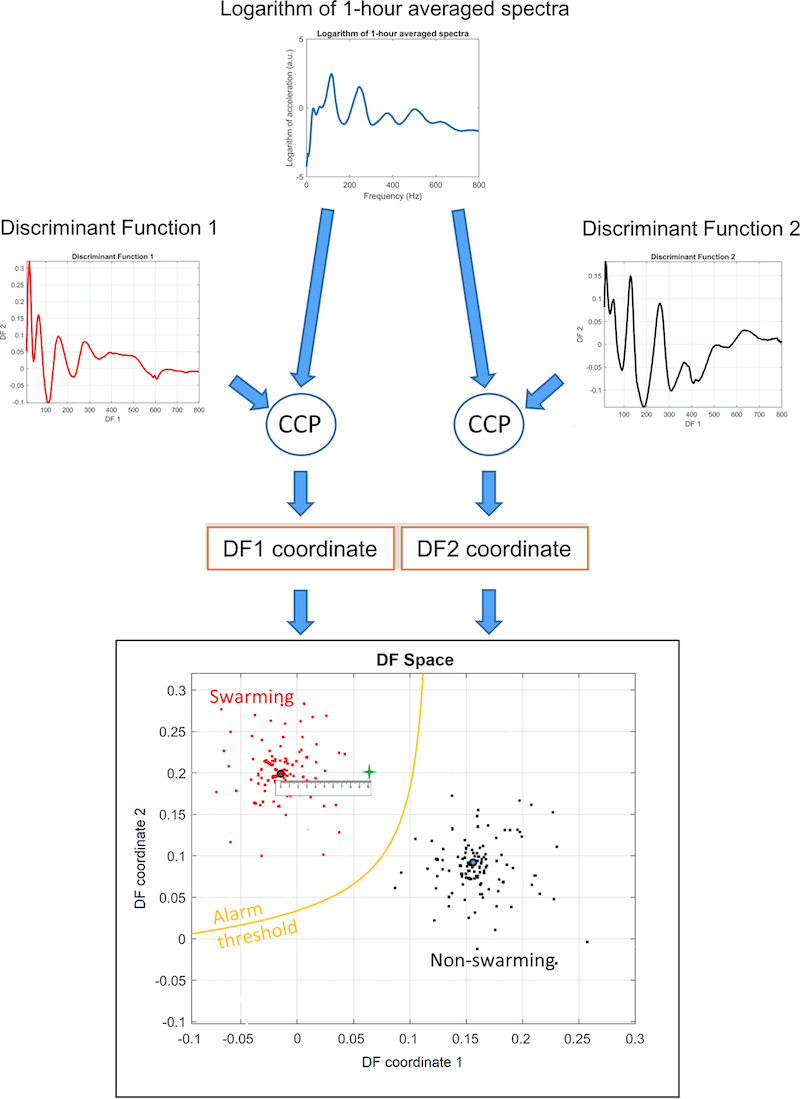
In the first (the instantaneous alarm procedure) they took a one hour reading from the hive and then compared it to the trained data. By computationally analysing discriminant functions (i.e. acoustic features characteristic of swarming or non-swarming hives) they could determine whether the test colony fell within the “swarming” or “non-swarming” category.
In the diagram above they show the application of two discriminant functions, but the actual study used three.
The second method used a much more complicated sounding three dimensional Fourier transform (conveniently abbreviated to 3DFT). In contrast to the first approach this involved analysis of the acoustic spectra collected over a ten day period.
3DFT sounds more complicated because it is more complicated. A Fourier transform converts a complex mix of signals into its individual components – for example, determining the individual volumes and frequencies (notes) in a musical chord. The diagram for this is a more colourful version of the one shown above, but is unlikely to help understand the process. If you insist you can view the original.
Application
Both methods were similar in that they used sound profiles collected from colonies known to have swarmed (or not) to define patterns characteristic of swarm preparation.
Interestingly, neither appear to show significant differences in the region of the spectrum Woods’ ‘warble’ occupied.
Having trained the software they went on to analyse colonies in an unknown state in an attempt to predict swarming.
Using the instantaneous analysis {{6}} 15 of 18 colonies that swarmed were correctly predicted, with no false positives in the colonies that did not swarm. Of those that swarmed, the prediction could be made an average of 22 days in advance of the first swarm leaving the colony.
That sounds like a pretty convincing 90% prediction rate. However, looking at the primary data – all 33 Mb of supplementary figures – it is clear that many of the swarmed colonies produced “swarm-like” signals well after swarming, without repeated swarming. As the authors state “false positives are still triggered occasionally on an hourly basis, and this becomes exacerbated when the time duration of the season under scrutiny is extended to the rest of the summer”.
So, it works OK for the first swarm of the year, but after that gives a lot of false positives.
It’s not clear from the figures what the range (or standard deviation) on the “22 day average warning” is. If it’s a range of 20-24 days that could be really useful, if it’s 3-45 days, less so.
Using the 3DFT methodology the authors could predict swarming in ~80% of colonies an average of 10±2 days before the swarm issued. Although this is a lower prediction rate, the clearly tighter time window might be more useful for practical beekeeping.
Again, the 3DFT approach produced signals that indicated swarming was imminent throughout the remainder of the season, often during periods of intense foraging. To exclude these the authors used averaged the night time values (midnight to 5am), rather than day-long assessments.
Take a deep breath
Overall, taking account of the false prediction rate and the false-positive triggering rate (the former being an overall incorrect prediction as to whether a colony will swarm, the second being ‘noise’ in the analysis when the threshold is reached), the authors favour the simpler “instantaneous” measurement method.
However, don’t be misled, this is not like Eddie Woods rocking up with his Apidictor, putting the stethoscope-like microphone on the side of the brood box and saying “take a deep breath”.
These colonies are being constantly monitored, with accelerometers embedded in the frames, and the associated wiring dangling out of the brood box.
I have run colonies with embedded hive temperature and humidity monitors {{7}}. The cabling is usually run under the crownboard and down between the frames. Along with 20,000 bees, it’s another thing that gets in the way during weekly inspections. In this paper Ramsey shows that the accelerometers can be fitted to any frame in the hive and still provide valid predictions. This offers the opportunity to perhaps use one of the ‘edge’ frames which would be more convenient than temperature monitors which have to be embedded in the centre of the brood nest.
I’m sure Woods’ Apidictor was not inexpensive in its day {{8}}. This current implementation of in-hive technology, despite the advances in microelectronics and computing, uses accurate and sensitive accelerometers which are also not inexpensive {{9}}. The apiary would need a power supply, computers and a way of transmitting a signal to the beekeeper (who is currently quaffing Barolo in a fancy trattoria anyway).
All of this is achievable.
But is it worth it?
And is it really needed?
Analogue beekeeping
The digital revolution and, most recently, the internet of things (IoT) has made monitoring “stuff” (like beehives, the house temperature, your fridge or coffee machine) inexpensive and relatively straightforward.
With smartphone apps you can be “in when you’re out” and get a warning that your colony is going to swarm … just as you sit down to lunch at Pierluigis.
The internet is littered with commercial and DIY hive monitoring equipment. Most of it is advertised, or at least promoted, as making beekeeping “easier”.
There’s the implication, stated or otherwise, that this type of automation reduces the need to conduct those pesky hive inspections.
But is that desirable?
What about all the other things you check when inspecting a colony?
Nectar collection … how heavy are the supers? Yes, you can monitor this electronically as well with hive scales. But what about …
- colony build up – how much space does the queen have to lay?
- sufficient stores – are they going to starve if it rains for a week?
- laying pattern of the queen – is she failing, is she a drone layer?
- signs of disease
- robbing etc.
I’m enthusiastic about technology but I’m not sure I’m enthusiastic about this technology.
Beekeeping is in many ways, already ‘easy’. It’s also an intensely practical discipline.
A thorough hive inspection tells you a whole lot more about the colony than its likelihood of swarming.
I’d actually argue that the easiest thing to determine qualitatively is whether a colony is thinking of swarming. All of those other things listed above – and lots that aren’t – are both important and only acquired by standing hunched over the hive.
If your hive monitors discouraged you from checking colonies so often how would be ever learn, or know, these other important things?
Finally, in closing, I reckon I could open a colony in mid-April and – based upon its strength and knowing a little bit about the local nectar flows – predict with 90% confidence whether it will swarm later in the season 😉
What do you think? Are you in favour of automating some aspects of beekeeping?
{{1}}: Aristotle. The Works of Aristotle the Famous Philosopher Containing his Complete Masterpiece and Family Physician; his Experienced Midwife, his Book of Problems and his Remarks on Physiognomy. (J. A. Publishing, 2018).
{{2}}: Woods, E. Electronic prediction of swarming in bees. Nature 184, 842–844 (1959).
{{3}}: Frankly that’s better than some beekeepers can manage when they’re inspecting the colony!
{{4}}: E.F. Woods, Bee Craft, August 1965.
{{5}}: Ramsey et al., (2020) The prediction of swarming in honeybee colonies using vibrational spectra. Scientific Reports 10: 9789. The paper is freely available under Open Access.
{{6}}: Which confusingly isn’t instantaneous … it really means data collected for only one hour, ignoring everything that has gone before. The monitors are permanently fitted in the hive and record a rolling one hour window.
{{7}}: And am currently building a homemade solution which I’ll discuss in a smorgasbord of linux, perl, RRD and DS18B20’s at some point in the future. This has nothing to do with swarming, but everything to do with rational and optimal Varroa control.
{{8}}: If anyone knows how much they were please contact me, or add it to the comments below.
{{9}}: I couldn’t find a purchase price for the Brüel and Kjær Type 4508 piezoelectric accelerometers used, but did find somewhere that would rent them for £4 a day. You’d need them for a few months per season. You’d have to sell a lot of honey to recoup that outlay.


Join the discussion ...